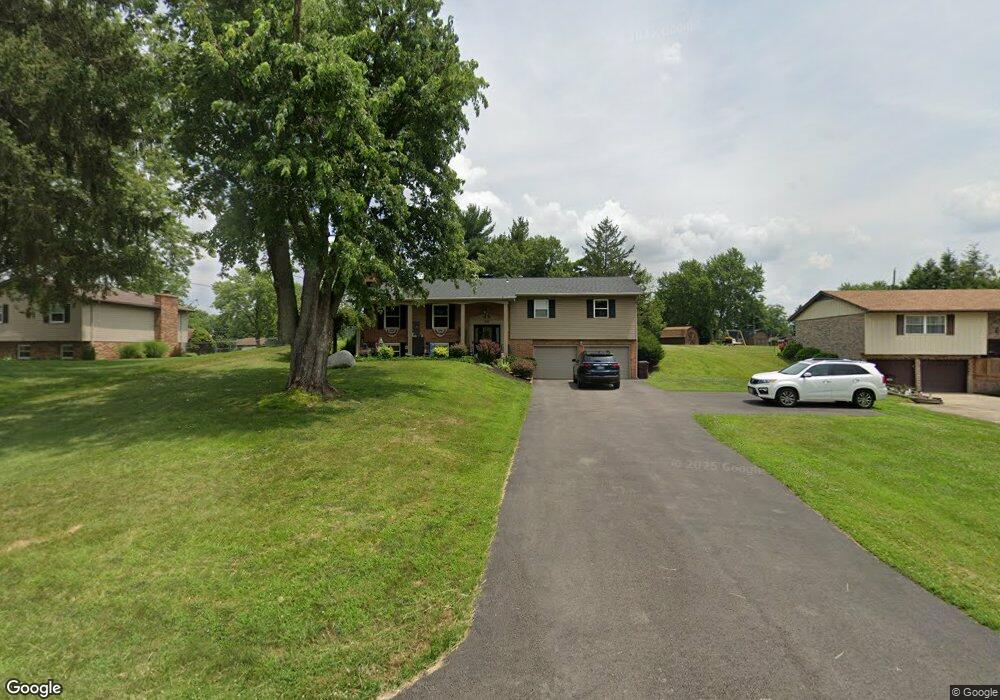
340 Chamberlain Rd Franklin, OH 45005
Estimated Value: $256,505 - $300,000
3
Beds
3
Baths
1,512
Sq Ft
$181/Sq Ft
Est. Value
About This Home
This home is located at 340 Chamberlain Rd, Franklin, OH 45005 and is currently estimated at $274,126, approximately $181 per square foot. 340 Chamberlain Rd is a home located in Warren County with nearby schools including Alden R Brown Elementary School, Chamberlain Middle School, and Carlisle High School.
Ownership History
Date
Name
Owned For
Owner Type
Purchase Details
Closed on
Jan 20, 2022
Sold by
Robinson Angela M and Buehner Angela M
Bought by
Buehner Ted A and Buehner Angela M
Current Estimated Value
Home Financials for this Owner
Home Financials are based on the most recent Mortgage that was taken out on this home.
Original Mortgage
$84,000
Outstanding Balance
$64,500
Interest Rate
2.43%
Mortgage Type
New Conventional
Estimated Equity
$209,626
Purchase Details
Closed on
Feb 17, 2009
Sold by
Robinson Kenneth J
Bought by
Robinson Angela M
Purchase Details
Closed on
Jul 18, 2005
Sold by
Cross Stephen V and Cross Paula M
Bought by
Robinson Kenneth J and Robinson Angela M
Home Financials for this Owner
Home Financials are based on the most recent Mortgage that was taken out on this home.
Original Mortgage
$127,300
Interest Rate
5.68%
Mortgage Type
Fannie Mae Freddie Mac
Purchase Details
Closed on
Nov 6, 1985
Sold by
Smallwood Smallwood and Smallwood Mary Delores
Bought by
Cross Cross and Cross Stephen V
Purchase Details
Closed on
Aug 19, 1981
Sold by
Hawkins Hawkins and Hawkins Ralph W
Purchase Details
Closed on
Jul 5, 1978
Sold by
Stanforth Stanforth and Stanforth Richard
Create a Home Valuation Report for This Property
The Home Valuation Report is an in-depth analysis detailing your home's value as well as a comparison with similar homes in the area
Home Values in the Area
Average Home Value in this Area
Purchase History
We collect this data history from publicly available records. To have your information removed, we recommend requesting removal directly through your county’s website.
| Date | Buyer | Sale Price | Title Company |
|---|---|---|---|
| Buehner Ted A | -- | None Listed On Document | |
| Robinson Angela M | -- | Attorney | |
| Robinson Kenneth J | $134,000 | -- | |
| Cross Cross | $70,500 | -- | |
| -- | $62,000 | -- | |
| -- | $59,900 | -- |
Source: Public Records
Mortgage History
We collect this data history from publicly available records. To have your information removed, we recommend requesting removal directly through your county’s website.
| Date | Status | Borrower | Loan Amount |
|---|---|---|---|
| Open | Buehner Ted A | $84,000 | |
| Previous Owner | Robinson Kenneth J | $127,300 |
Source: Public Records
Tax History
| Year | Tax Paid | Tax Assessment Tax Assessment Total Assessment is a certain percentage of the fair market value that is determined by local assessors to be the total taxable value of land and additions on the property. | Land | Improvement |
|---|---|---|---|---|
| 2025 | $2,949 | $77,000 | $17,850 | $59,150 |
| 2024 | $2,949 | $77,000 | $17,850 | $59,150 |
| 2023 | $2,393 | $56,430 | $11,151 | $45,279 |
| 2022 | $2,377 | $56,431 | $11,151 | $45,280 |
| 2021 | $2,295 | $56,431 | $11,151 | $45,280 |
| 2020 | $2,228 | $47,824 | $9,450 | $38,374 |
| 2019 | $2,260 | $47,824 | $9,450 | $38,374 |
| 2018 | $2,234 | $47,824 | $9,450 | $38,374 |
| 2017 | $2,105 | $41,076 | $8,250 | $32,827 |
| 2016 | $1,839 | $41,076 | $8,250 | $32,827 |
| 2015 | $1,844 | $41,076 | $8,250 | $32,827 |
| 2014 | $1,800 | $39,880 | $8,010 | $31,870 |
| 2013 | $1,772 | $52,290 | $10,500 | $41,790 |
Source: Public Records
Map
Nearby Homes
- 8677 Oriole Dr
- 8653 Twincreek Dr
- 7401 Beth Ct
- 207 Quail Run Ct
- 7278 Beth Ct
- 425 W Lomar Ave
- 8233 Meadowlark Dr
- 467 E Lomar Ave
- 467 E Lomar Dr
- 940 Carolyn Ct
- 165 Baker Ln
- 571 Elm Dr
- 155 Vernon Place
- 3008 Doe Dr
- 8115 Martz-Paulin Rd
- 90 Timber Creek Dr
- 7869 Dubois Rd
- 870 Marty Lee Ln
- 7854 Lowe Dr
- 602 W Crescent Ln
- 350 Chamberlain Rd
- 330 Chamberlain Rd
- 341 Lantis Dr
- 320 Chamberlain Rd
- 351 Lantis Dr
- 7528 Red Robin St
- 331 Chamberlain Rd
- 341 Chamberlain Rd
- 7560 Red Robin St
- 331 Lantis Dr
- 321 Chamberlain Rd
- 300 Chamberlain Rd
- 8980 Meadowlark Dr
- 321 Lantis Dr
- 311 Chamberlain Rd
- 7490 Red Robin St
- 1041 Mount Dr
- 351 Chamberlain Rd
- 301 Chamberlain Rd
- 311 Lantis Dr
Your Personal Tour Guide
Ask me questions while you tour the home.