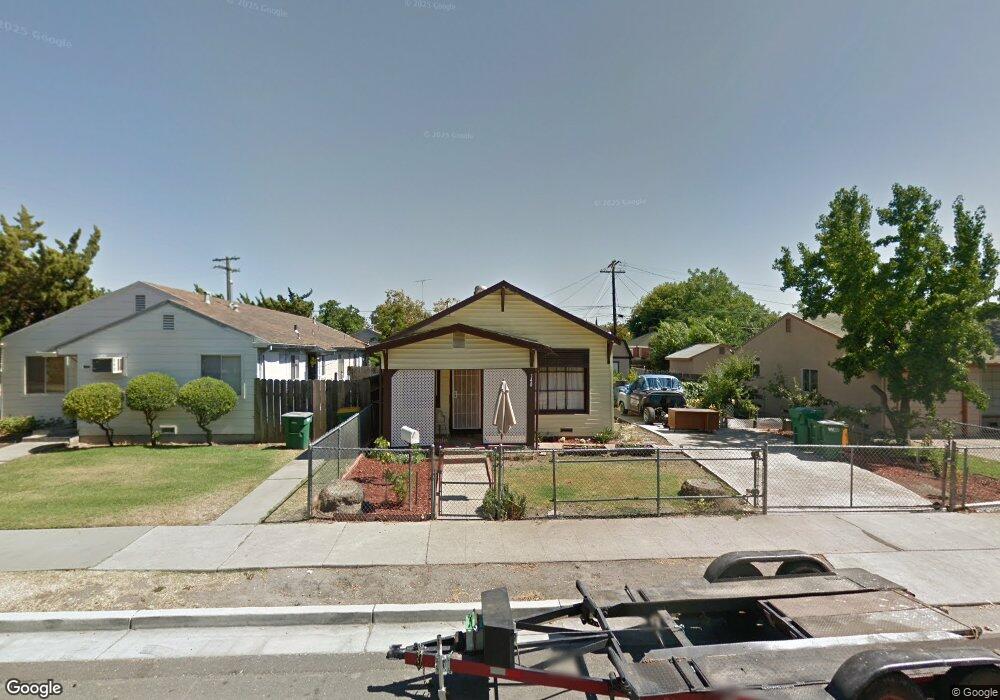
340 E Noble St Stockton, CA 95204
Midtown NeighborhoodEstimated Value: $250,000 - $335,000
2
Beds
1
Bath
810
Sq Ft
$351/Sq Ft
Est. Value
About This Home
This home is located at 340 E Noble St, Stockton, CA 95204 and is currently estimated at $284,119, approximately $350 per square foot. 340 E Noble St is a home located in San Joaquin County with nearby schools including Wilson Elementary School, Cleveland Elementary School, and El Dorado Elementary School.
Ownership History
Date
Name
Owned For
Owner Type
Purchase Details
Closed on
Aug 30, 2023
Sold by
Eckroth Brandy A
Bought by
Eckroth Estates 2023 Trust and Eckroth
Current Estimated Value
Purchase Details
Closed on
Aug 30, 2011
Sold by
Eckroth Larry
Bought by
Eckroth Brandy
Home Financials for this Owner
Home Financials are based on the most recent Mortgage that was taken out on this home.
Original Mortgage
$32,000
Interest Rate
4.46%
Mortgage Type
Seller Take Back
Purchase Details
Closed on
Mar 21, 2007
Sold by
Key Travis and The Key Family Trust
Bought by
Key Travis and Key Cathy
Purchase Details
Closed on
Feb 4, 1994
Sold by
Key Cathy
Bought by
Key Travis
Home Financials for this Owner
Home Financials are based on the most recent Mortgage that was taken out on this home.
Original Mortgage
$30,000
Interest Rate
7.1%
Create a Home Valuation Report for This Property
The Home Valuation Report is an in-depth analysis detailing your home's value as well as a comparison with similar homes in the area
Home Values in the Area
Average Home Value in this Area
Purchase History
| Date | Buyer | Sale Price | Title Company |
|---|---|---|---|
| Eckroth Estates 2023 Trust | -- | None Listed On Document | |
| Eckroth Brandy | -- | Old Republic Title Company | |
| Eckroth Brandy | $40,000 | Old Republic Title Company | |
| Key Travis | -- | None Available | |
| Key Travis | -- | Old Republic Title Co |
Source: Public Records
Mortgage History
| Date | Status | Borrower | Loan Amount |
|---|---|---|---|
| Previous Owner | Eckroth Brandy | $32,000 | |
| Previous Owner | Key Travis | $30,000 |
Source: Public Records
Tax History
| Year | Tax Paid | Tax Assessment Tax Assessment Total Assessment is a certain percentage of the fair market value that is determined by local assessors to be the total taxable value of land and additions on the property. | Land | Improvement |
|---|---|---|---|---|
| 2025 | $667 | $50,235 | $12,557 | $37,678 |
| 2024 | $656 | $49,251 | $12,311 | $36,940 |
| 2023 | $642 | $48,286 | $12,070 | $36,216 |
| 2022 | $612 | $47,340 | $11,834 | $35,506 |
| 2021 | $589 | $46,412 | $11,602 | $34,810 |
| 2020 | $600 | $45,938 | $11,484 | $34,454 |
| 2019 | $597 | $45,038 | $11,259 | $33,779 |
| 2018 | $586 | $44,156 | $11,039 | $33,117 |
| 2017 | $556 | $43,291 | $10,823 | $32,468 |
| 2016 | $565 | $42,441 | $10,610 | $31,831 |
| 2014 | $540 | $40,985 | $10,246 | $30,739 |
Source: Public Records
Map
Nearby Homes
- 2212 N Sutter St
- 122 E Monterey Ave
- 116 E Noble St
- 207 E Adams St
- 2820 N El Dorado St
- 64 E Noble St
- 61 E Ellis St
- 3026 N American St
- 405 E Cleveland St
- 11 E Geary St
- 33 E Pine St
- 321 E Euclid Ave
- 402 E Wyandotte St
- 3427 N Hunter St
- 52 W Adams St
- 1941 N El Dorado St
- 235 E Knoles Way
- 1900 N El Dorado St
- 1905 N El Dorado St
- 44 W Alpine Ave
- 328 E Noble St
- 346 E Noble St
- 320 E Noble St
- 341 E Ellis St
- 335 E Ellis St
- 347 E Ellis St
- 333 E Ellis St
- 339 E Noble St
- 321 E Ellis St
- 408 E Noble St
- 327 E Noble St
- 343 E Noble St
- 401 E Ellis St
- 315 E Noble St
- 309 E Ellis St
- 2624 N San Joaquin St
- 401 E Noble St
- 412 E Noble St
- 311 E Noble St
- 405 E Ellis St
Your Personal Tour Guide
Ask me questions while you tour the home.