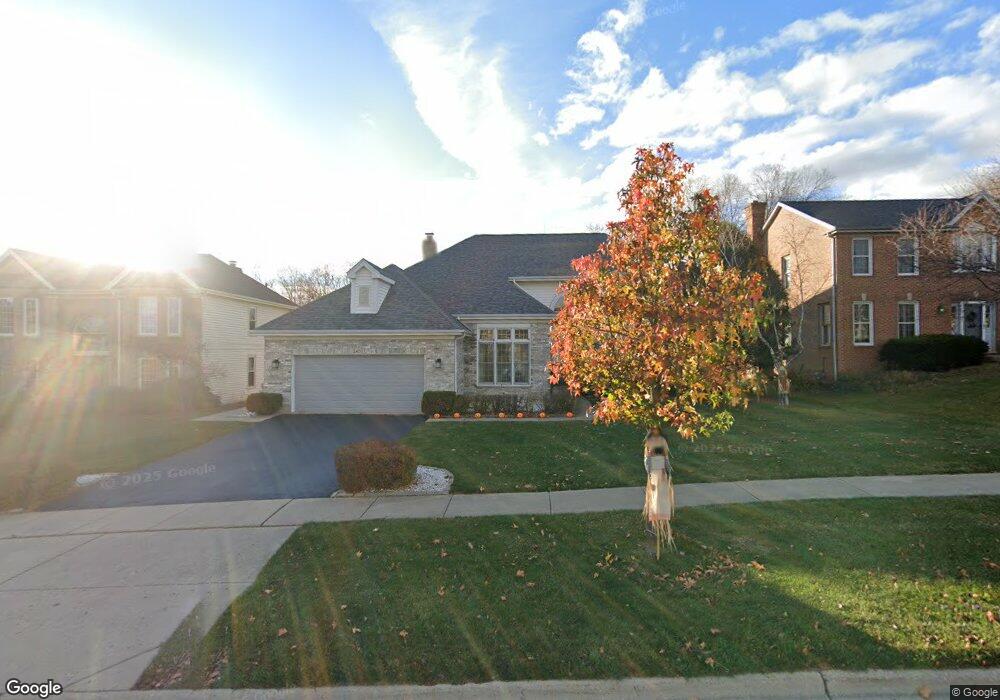
340 Fieldcrest Dr Algonquin, IL 60102
Estimated Value: $450,368 - $533,000
5
Beds
4
Baths
2,612
Sq Ft
$188/Sq Ft
Est. Value
About This Home
This home is located at 340 Fieldcrest Dr, Algonquin, IL 60102 and is currently estimated at $489,842, approximately $187 per square foot. 340 Fieldcrest Dr is a home located in McHenry County with nearby schools including Westfield Community School, Lincoln Prairie Elementary School, and Harry D Jacobs High School.
Ownership History
Date
Name
Owned For
Owner Type
Purchase Details
Closed on
Aug 26, 2021
Sold by
Anderopolis Jay J and Capone Cindy Lee
Bought by
Andrapolis Jay J and Capone Cindy Lee
Current Estimated Value
Home Financials for this Owner
Home Financials are based on the most recent Mortgage that was taken out on this home.
Original Mortgage
$263,280
Outstanding Balance
$240,685
Interest Rate
3.12%
Mortgage Type
New Conventional
Estimated Equity
$249,157
Purchase Details
Closed on
Nov 29, 2007
Sold by
Tabel Ronald E and Tabel Maureen
Bought by
Andropolis Jay J and Andropolis Cindy
Home Financials for this Owner
Home Financials are based on the most recent Mortgage that was taken out on this home.
Original Mortgage
$296,000
Interest Rate
6.47%
Mortgage Type
Unknown
Create a Home Valuation Report for This Property
The Home Valuation Report is an in-depth analysis detailing your home's value as well as a comparison with similar homes in the area
Purchase History
| Date | Buyer | Sale Price | Title Company |
|---|---|---|---|
| Andrapolis Jay J | -- | None Available | |
| Andropolis Jay J | $370,000 | Ticor |
Source: Public Records
Mortgage History
| Date | Status | Borrower | Loan Amount |
|---|---|---|---|
| Open | Andrapolis Jay J | $263,280 | |
| Closed | Andropolis Jay J | $296,000 |
Source: Public Records
Tax History
| Year | Tax Paid | Tax Assessment Tax Assessment Total Assessment is a certain percentage of the fair market value that is determined by local assessors to be the total taxable value of land and additions on the property. | Land | Improvement |
|---|---|---|---|---|
| 2024 | $9,233 | $134,033 | $22,766 | $111,267 |
| 2023 | $8,696 | $119,875 | $20,361 | $99,514 |
| 2022 | $10,072 | $128,444 | $27,915 | $100,529 |
| 2021 | $9,642 | $119,661 | $26,006 | $93,655 |
| 2020 | $9,377 | $115,425 | $25,085 | $90,340 |
| 2019 | $9,134 | $110,475 | $24,009 | $86,466 |
| 2018 | $9,156 | $102,055 | $22,179 | $79,876 |
| 2017 | $8,976 | $96,142 | $20,894 | $75,248 |
| 2016 | $8,852 | $90,173 | $19,597 | $70,576 |
| 2013 | -- | $81,411 | $18,282 | $63,129 |
Source: Public Records
Map
Nearby Homes
- 1431 Essex St
- 135 Arquilla Dr
- 1354 Essex St Unit 2
- 700 Fairfield Ln
- 1920 Jester Ln
- 7 Falcon Ridge Ct
- 145 S Oakleaf Rd
- 909 Roger St
- LOT 3 Blackhawk Dr
- 313 Bayberry Dr
- 681 Majestic Dr
- 30 Echo Hill
- 14 Wander Way
- 1820 Crofton Dr
- 760 Regal Ln
- 338 Hiawatha Dr
- 119 Lake Dr
- 113 Pheasant Trail
- 101 Oakleaf Rd
- 1002 Interloch Ct Unit 152
- 330 Fieldcrest Dr
- 400 Fieldcrest Dr
- 341 Briarwood Ln
- 320 Fieldcrest Dr
- 401 Briarwood Ln
- 331 Briarwood Ln Unit 1B
- 410 Fieldcrest Dr Unit 1A
- 341 Fieldcrest Dr
- 321 Briarwood Ln
- 411 Briarwood Ln
- 331 Fieldcrest Dr
- 401 Fieldcrest Dr
- 310 Fieldcrest Dr
- 420 Fieldcrest Dr
- 321 Fieldcrest Dr
- 411 Fieldcrest Dr
- 421 Briarwood Ln Unit 1B
- 311 Fieldcrest Dr
- 300 Fieldcrest Dr
- 1600 Fieldcrest Dr
Your Personal Tour Guide
Ask me questions while you tour the home.