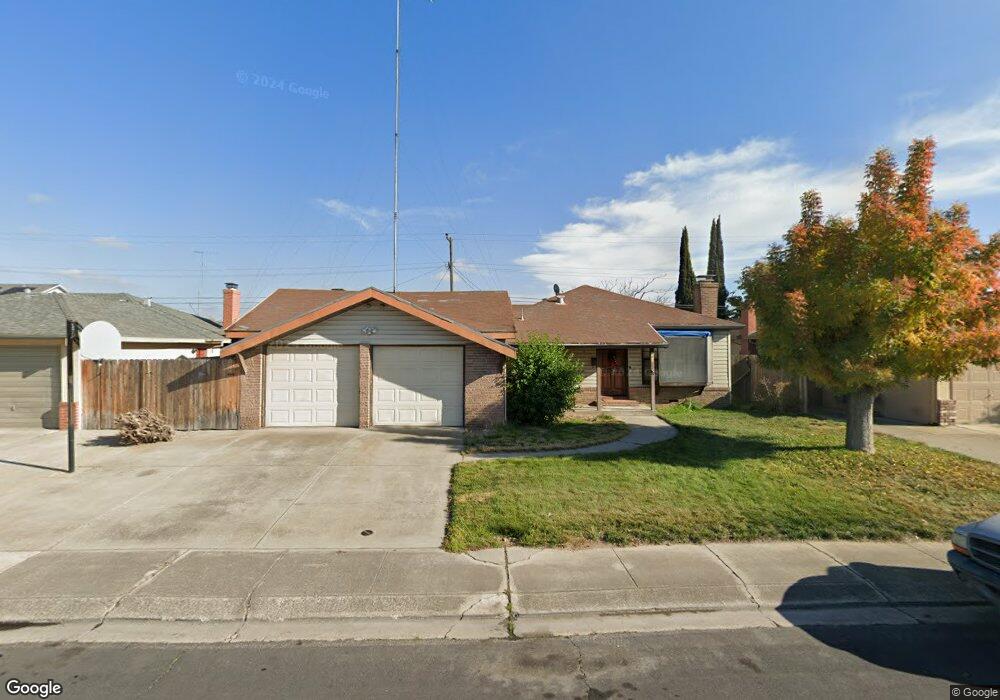
340 Harding Ave Manteca, CA 95336
Downtown Manteca NeighborhoodEstimated Value: $442,363 - $459,000
3
Beds
2
Baths
1,436
Sq Ft
$315/Sq Ft
Est. Value
About This Home
This home is located at 340 Harding Ave, Manteca, CA 95336 and is currently estimated at $452,841, approximately $315 per square foot. 340 Harding Ave is a home located in San Joaquin County with nearby schools including Shasta Elementary School, Manteca High School, and St. Anthony's Catholic School.
Ownership History
Date
Name
Owned For
Owner Type
Purchase Details
Closed on
Sep 5, 2014
Sold by
Eggink Dennis and Eggink Virginia
Bought by
Eggink Dennis
Current Estimated Value
Home Financials for this Owner
Home Financials are based on the most recent Mortgage that was taken out on this home.
Original Mortgage
$116,700
Outstanding Balance
$86,613
Interest Rate
3.86%
Mortgage Type
New Conventional
Estimated Equity
$366,228
Purchase Details
Closed on
May 21, 1998
Sold by
Va
Bought by
Cazzell Larry W and Cazzell Jeanmarie
Home Financials for this Owner
Home Financials are based on the most recent Mortgage that was taken out on this home.
Original Mortgage
$112,500
Interest Rate
7.07%
Purchase Details
Closed on
May 18, 1998
Sold by
Cazzell Larry W and Cazzell J M
Bought by
Eggink Dennis and Eggink Virginia
Home Financials for this Owner
Home Financials are based on the most recent Mortgage that was taken out on this home.
Original Mortgage
$112,500
Interest Rate
7.07%
Create a Home Valuation Report for This Property
The Home Valuation Report is an in-depth analysis detailing your home's value as well as a comparison with similar homes in the area
Home Values in the Area
Average Home Value in this Area
Purchase History
| Date | Buyer | Sale Price | Title Company |
|---|---|---|---|
| Eggink Dennis | -- | Servicelink | |
| Cazzell Larry W | -- | Old Republic Title Company | |
| Eggink Dennis | $125,000 | Old Republic Title Company |
Source: Public Records
Mortgage History
| Date | Status | Borrower | Loan Amount |
|---|---|---|---|
| Open | Eggink Dennis | $116,700 | |
| Closed | Eggink Dennis | $112,500 |
Source: Public Records
Tax History
| Year | Tax Paid | Tax Assessment Tax Assessment Total Assessment is a certain percentage of the fair market value that is determined by local assessors to be the total taxable value of land and additions on the property. | Land | Improvement |
|---|---|---|---|---|
| 2025 | $2,155 | $199,577 | $63,863 | $135,714 |
| 2024 | $2,093 | $195,664 | $62,611 | $133,053 |
| 2023 | $2,066 | $191,829 | $61,384 | $130,445 |
| 2022 | $2,034 | $188,069 | $60,181 | $127,888 |
| 2021 | $2,010 | $184,382 | $59,001 | $125,381 |
| 2020 | $1,928 | $182,493 | $58,397 | $124,096 |
| 2019 | $1,902 | $178,915 | $57,252 | $121,663 |
| 2018 | $1,875 | $175,408 | $56,130 | $119,278 |
| 2017 | $1,847 | $171,970 | $55,030 | $116,940 |
| 2016 | $1,801 | $168,599 | $53,952 | $114,647 |
| 2015 | $1,789 | $166,066 | $53,141 | $112,925 |
| 2014 | $1,673 | $162,813 | $52,100 | $110,713 |
Source: Public Records
Map
Nearby Homes
- 355 Harding Ave
- 628 E North St
- 467 E Alameda St
- 119 N Sherman Ave
- 930 Palomino St
- 544 Hawes St
- 311 Charles Ave
- 322 Poplar Ave
- 316 Poplar Ave
- 196 Dyer Ave
- 317 Moffat Blvd Unit 21
- 317 Moffat Blvd Unit 14
- 317 Moffat Blvd Unit 6
- 317 Moffat Blvd Unit 5
- 317 Moffat Blvd Unit 7
- 317 Moffat Blvd Unit 20
- 736 E Louise Ave
- 1275 Armstrong Dr
- 1250 Slayton Dr
- 207 Park Ave
- 328 Harding Ave
- 344 Harding Ave
- 339 Roosevelt Ave
- 345 Roosevelt Ave
- 348 Harding Ave
- 324 Harding Ave
- 335 Roosevelt Ave
- 349 Roosevelt Ave
- 339 Harding Ave
- 345 Harding Ave
- 329 Roosevelt Ave
- 349 Harding Ave
- 352 Harding Ave
- 355 Roosevelt Ave
- 320 Harding Ave
- 329 Harding Ave
- 325 Roosevelt Ave
- 359 Roosevelt Ave
- 325 Harding Ave
- 344 Roosevelt Ave
Your Personal Tour Guide
Ask me questions while you tour the home.