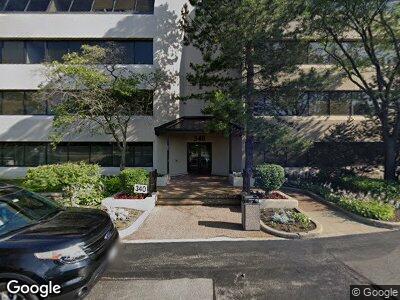
340 W Butterfield Rd Unit 3A Elmhurst, IL 60126
Estimated Value: $412,516
--
Bed
--
Bath
--
Sq Ft
2
Acres
About This Home
This home is located at 340 W Butterfield Rd Unit 3A, Elmhurst, IL 60126 and is currently estimated at $412,516. 340 W Butterfield Rd Unit 3A is a home located in DuPage County with nearby schools including Salt Creek Elementary School, Stella May Swartz Elementary School, and John E Albright Middle School.
Ownership History
Date
Name
Owned For
Owner Type
Purchase Details
Closed on
Sep 18, 2018
Sold by
Summit League Inc
Bought by
Lumen Real Estate Llc
Current Estimated Value
Purchase Details
Closed on
Nov 16, 2015
Sold by
New Continental Realty Llc
Bought by
The Summit League Inc
Purchase Details
Closed on
May 13, 2008
Sold by
Oak Services Inc
Bought by
New Continental Realty Llc
Home Financials for this Owner
Home Financials are based on the most recent Mortgage that was taken out on this home.
Original Mortgage
$400,000
Interest Rate
6.5%
Mortgage Type
Commercial
Purchase Details
Closed on
Jul 14, 1999
Sold by
Oak Brook Bank
Bought by
The Oak Agency Inc
Home Financials for this Owner
Home Financials are based on the most recent Mortgage that was taken out on this home.
Original Mortgage
$168,627
Interest Rate
7%
Mortgage Type
Commercial
Create a Home Valuation Report for This Property
The Home Valuation Report is an in-depth analysis detailing your home's value as well as a comparison with similar homes in the area
Home Values in the Area
Average Home Value in this Area
Purchase History
| Date | Buyer | Sale Price | Title Company |
|---|---|---|---|
| Lumen Real Estate Llc | $299,000 | Attorneys Title Guaranty Fun | |
| The Summit League Inc | $296,000 | Attorneys Title Guaranty Fun | |
| New Continental Realty Llc | $500,000 | First American Title | |
| The Oak Agency Inc | -- | -- |
Source: Public Records
Mortgage History
| Date | Status | Borrower | Loan Amount |
|---|---|---|---|
| Previous Owner | New Continental Realty Llc | $400,000 | |
| Previous Owner | The Oak Agency Inc | $270,000 | |
| Previous Owner | The Oak Agency Inc | $200,000 | |
| Previous Owner | The Oak Agency Inc | $168,627 |
Source: Public Records
Tax History Compared to Growth
Tax History
| Year | Tax Paid | Tax Assessment Tax Assessment Total Assessment is a certain percentage of the fair market value that is determined by local assessors to be the total taxable value of land and additions on the property. | Land | Improvement |
|---|---|---|---|---|
| 2023 | $5,609 | $111,170 | $36,360 | $74,810 |
| 2022 | $5,250 | $105,790 | $34,600 | $71,190 |
| 2021 | $5,349 | $103,160 | $33,740 | $69,420 |
| 2020 | $5,404 | $102,910 | $33,000 | $69,910 |
| 2019 | $5,206 | $97,840 | $31,370 | $66,470 |
| 2018 | $0 | $0 | $0 | $0 |
| 2017 | $2,853 | $0 | $0 | $0 |
| 2016 | $2,853 | $0 | $0 | $0 |
| 2015 | $6,559 | $108,640 | $24,830 | $83,810 |
| 2014 | $8,301 | $131,080 | $23,420 | $107,660 |
| 2013 | $8,208 | $132,930 | $23,750 | $109,180 |
Source: Public Records
Map
Nearby Homes
- 427 W Commonwealth Ln
- 957 S Hillside Ave
- 956 S Spring Rd
- 1S045 Spring Rd Unit 3F
- 952 S Fairfield Ave
- 936 S Mitchell Ave
- 175 W Brush Hill Rd Unit 103
- 493 W Dorchester Place
- 953 S Parkside Ave
- 901 S Fairfield Ave
- 328 Walnut Ln
- 1S150 Spring Rd Unit 4I
- 1S150 Spring Rd Unit 2H
- 889 S Fairfield Ave
- 934 S Bryan St
- 110 W Butterfield Rd Unit 107S
- 110 W Butterfield Rd Unit 214S
- 110 W Butterfield Rd Unit 405S
- 5 Oak Brook Club Dr Unit N101
- 265 W Adams St
- 340 W Butterfield Rd
- 340 W Butterfield Rd
- 340 W Butterfield Rd
- 340 W Butterfield Rd Unit 4A4D
- 340 W Butterfield Rd Unit 3D
- 340 W Butterfield Rd Unit 3C
- 340 W Butterfield Rd Unit 3B
- 340 W Butterfield Rd Unit 3A
- 340 W Butterfield Rd Unit 2D
- 340 W Butterfield Rd Unit 2C
- 340 W Butterfield Rd
- 340 W Butterfield Rd Unit 2A
- 340 W Butterfield Rd Unit 1D
- 340 W Butterfield Rd Unit 1C
- 340 W Butterfield Rd Unit 1B
- 340 W Butterfield Rd Unit 1A
- 340 W Butterfield Rd Unit LB
- 340 W Butterfield Rd Unit LLA
- 340 W Butterfield Rd Unit 4A
- 340 W Butterfield Rd Unit 2B