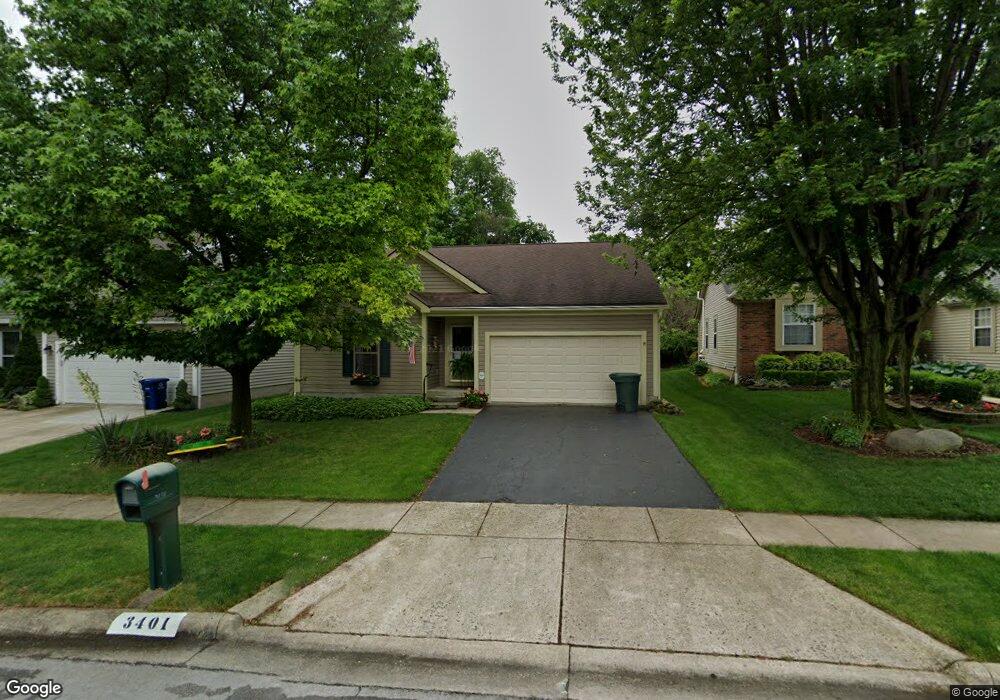
3401 La Coste Ln Columbus, OH 43228
Scioto Woods NeighborhoodEstimated Value: $311,912 - $345,000
3
Beds
2
Baths
1,162
Sq Ft
$288/Sq Ft
Est. Value
About This Home
This home is located at 3401 La Coste Ln, Columbus, OH 43228 and is currently estimated at $334,978, approximately $288 per square foot. 3401 La Coste Ln is a home located in Franklin County with nearby schools including Galloway Ridge Intermediate School, Prairie Lincoln Elementary School, and Norton Middle School.
Ownership History
Date
Name
Owned For
Owner Type
Purchase Details
Closed on
Aug 10, 2022
Sold by
Kerschner Donald O and Kerschner Nancy L
Bought by
Kerschner Scott
Current Estimated Value
Home Financials for this Owner
Home Financials are based on the most recent Mortgage that was taken out on this home.
Original Mortgage
$50,000
Outstanding Balance
$47,874
Interest Rate
5.7%
Mortgage Type
New Conventional
Estimated Equity
$287,104
Purchase Details
Closed on
Sep 25, 1996
Sold by
Berndt Linda L
Bought by
Kerschner Donald O and Kerschner Nancy L
Home Financials for this Owner
Home Financials are based on the most recent Mortgage that was taken out on this home.
Original Mortgage
$45,000
Interest Rate
7.97%
Mortgage Type
New Conventional
Purchase Details
Closed on
Apr 14, 1992
Purchase Details
Closed on
Feb 21, 1991
Create a Home Valuation Report for This Property
The Home Valuation Report is an in-depth analysis detailing your home's value as well as a comparison with similar homes in the area
Home Values in the Area
Average Home Value in this Area
Purchase History
| Date | Buyer | Sale Price | Title Company |
|---|---|---|---|
| Kerschner Scott | $250,000 | Search2close | |
| Kerschner Donald O | $115,000 | -- | |
| -- | $95,700 | -- | |
| -- | -- | -- |
Source: Public Records
Mortgage History
| Date | Status | Borrower | Loan Amount |
|---|---|---|---|
| Open | Kerschner Scott | $50,000 | |
| Previous Owner | Kerschner Donald O | $45,000 |
Source: Public Records
Tax History Compared to Growth
Tax History
| Year | Tax Paid | Tax Assessment Tax Assessment Total Assessment is a certain percentage of the fair market value that is determined by local assessors to be the total taxable value of land and additions on the property. | Land | Improvement |
|---|---|---|---|---|
| 2024 | $3,299 | $90,480 | $38,610 | $51,870 |
| 2023 | $3,241 | $90,475 | $38,605 | $51,870 |
| 2022 | $2,587 | $61,750 | $12,850 | $48,900 |
| 2021 | $2,639 | $61,750 | $12,850 | $48,900 |
| 2020 | $2,624 | $61,750 | $12,850 | $48,900 |
| 2019 | $2,357 | $50,760 | $10,260 | $40,500 |
| 2018 | $2,310 | $50,760 | $10,260 | $40,500 |
| 2017 | $2,305 | $50,760 | $10,260 | $40,500 |
| 2016 | $2,275 | $46,350 | $10,470 | $35,880 |
| 2015 | $2,275 | $46,350 | $10,470 | $35,880 |
| 2014 | $2,277 | $46,350 | $10,470 | $35,880 |
| 2013 | $1,129 | $46,340 | $10,465 | $35,875 |
Source: Public Records
Map
Nearby Homes
- 3495 La Coste Ln
- 3664 Grimes Dr
- 3254 Dover Rd
- 3252 Dover Rd
- 3161 Bowdoin Cir
- 3757 Gibbstone Dr
- 3761 Gibbstone Dr
- 3570 Dover Rd
- 1150 Romona Place
- 2051 Tuckaway Ct
- 4000 Sandy Ridge Dr
- 2754 Scioto Station Dr
- 2704 Scioto Station Dr Unit 2704
- 0 Lowell Dr Unit 223009270
- 2875 Lowell Dr
- 2262 Quarry Trails Dr
- 2248 Quarry Trails Dr
- 2250 Quarry Trails Dr
- 2867 Kobuk Dr Unit 404
- 2867 Kobuk Dr Unit 304
- 3393 La Coste Ln
- 3407 La Coste Ln
- 3389 La Coste Ln
- 3413 La Coste Ln
- 3383 La Coste Ln
- 3408 La Coste Ln
- 3419 La Coste Ln
- 3400 La Coste Ln
- 3392 La Coste Ln
- 3377 La Coste Ln
- 3414 La Coste Ln
- 3386 La Coste Ln
- 3425 La Coste Ln
- 3371 La Coste Ln
- 3380 La Coste Ln
- 1526 Beaman Dr
- 1532 Beaman Dr
- 1520 Beaman Dr
- 3365 Laccoste Ln
- 3365 La Coste Ln