A
Seller's Agent in 2023
Alexis Stecklein
Lotus Advisors
(614) 357-5260
2 Total Sales
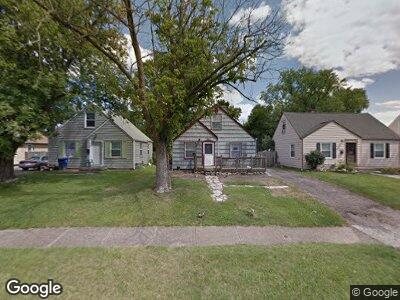
Estimated Value: $130,000 - $205,000
JUST renovated! Cape Cod style 3 Bedroom, 1 Bath, Single family home with unfinished basement and fenced in back yard. Located between Clintonville and North Linden, easy access to I-71. Neighborhood setting with off street parking, front lawn and small patio deck. Just installed LVP flooring in kitchen and living room with carpet throughout. Fresh coat of paint on walls and brand NEW appliances and front Door going in. Lighting fixtures being replaced. Washer/Dryer hookup, Central air, and pets allowed.
| Date | Buyer | Sale Price | Title Company |
|---|---|---|---|
| Bratka Christine L | $55,000 | Chicago Title West | |
| Morequity Inc | $55,000 | -- | |
| Bean Letitia | $97,000 | -- | |
| -- | $48,500 | -- | |
| -- | -- | -- |
| Date | Status | Borrower | Loan Amount |
|---|---|---|---|
| Previous Owner | Bean Letitia | $72,750 |
| Date | Event | Price | Change | Sq Ft Price |
|---|---|---|---|---|
| 03/31/2025 03/31/25 | Off Market | $1,195 | -- | -- |
| 03/28/2025 03/28/25 | Off Market | $1,395 | -- | -- |
| 12/29/2023 12/29/23 | Rented | $1,395 | 0.0% | -- |
| 11/02/2023 11/02/23 | For Rent | $1,395 | +16.7% | -- |
| 07/15/2021 07/15/21 | Rented | $1,195 | 0.0% | -- |
| 07/07/2021 07/07/21 | For Rent | $1,195 | -- | -- |
| Year | Tax Paid | Tax Assessment Tax Assessment Total Assessment is a certain percentage of the fair market value that is determined by local assessors to be the total taxable value of land and additions on the property. | Land | Improvement |
|---|---|---|---|---|
| 2024 | $2,304 | $50,270 | $10,890 | $39,380 |
| 2023 | $2,275 | $50,270 | $10,890 | $39,380 |
| 2022 | $1,760 | $33,110 | $5,320 | $27,790 |
| 2021 | $1,877 | $33,110 | $5,320 | $27,790 |
| 2020 | $1,945 | $33,110 | $5,320 | $27,790 |
| 2019 | $1,665 | $26,780 | $4,240 | $22,540 |
| 2018 | $831 | $26,780 | $4,240 | $22,540 |
| 2017 | $1,665 | $26,780 | $4,240 | $22,540 |
| 2016 | $1,337 | $19,680 | $4,030 | $15,650 |
| 2015 | $609 | $19,680 | $4,030 | $15,650 |
| 2014 | $1,220 | $19,680 | $4,030 | $15,650 |
| 2013 | $634 | $20,720 | $4,235 | $16,485 |
A
Seller's Agent in 2023
Alexis Stecklein
Lotus Advisors
(614) 357-5260
2 Total Sales
S
Seller's Agent in 2021
Sarah Doughty
Lotus Advisors

Buyer's Agent in 2021
Kelly Gaillard
RE/MAX
(614) 440-3993
3 Total Sales