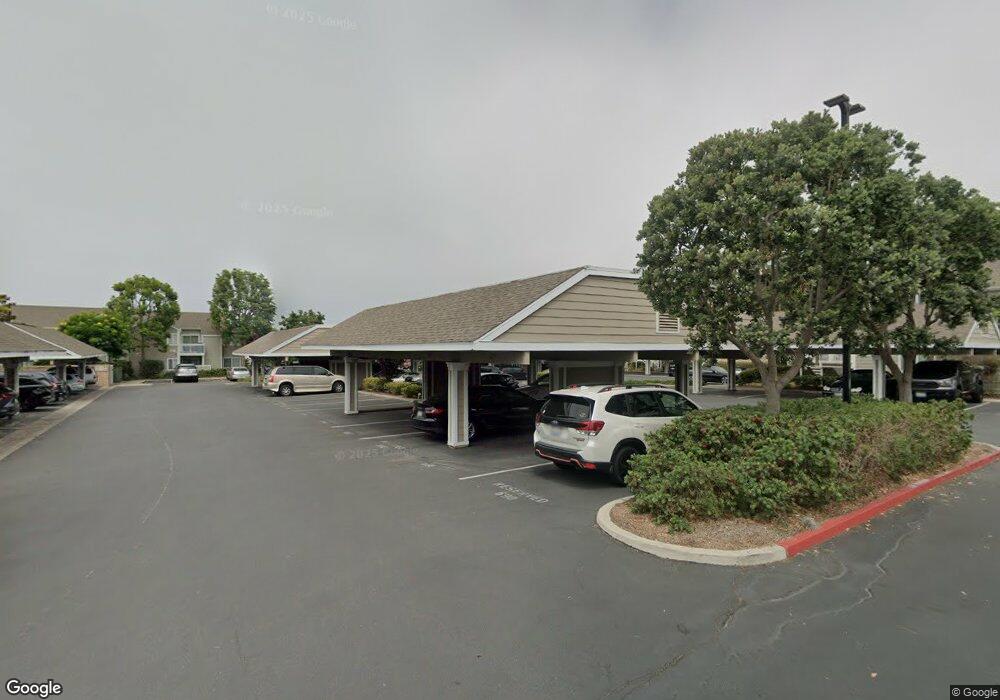
34022 Selva Rd Unit 50 Dana Point, CA 92629
Monarch Beach NeighborhoodEstimated Value: $610,895 - $852,000
1
Bed
1
Bath
701
Sq Ft
$1,091/Sq Ft
Est. Value
About This Home
This home is located at 34022 Selva Rd Unit 50, Dana Point, CA 92629 and is currently estimated at $764,724, approximately $1,090 per square foot. 34022 Selva Rd Unit 50 is a home located in Orange County with nearby schools including Richard Henry Dana Elementary School, Marco Forster Middle School, and Dana Hills High School.
Ownership History
Date
Name
Owned For
Owner Type
Purchase Details
Closed on
Dec 5, 2002
Sold by
Foor Gail M
Bought by
Foor Gail M and Gail M Foor Revocable Trust
Current Estimated Value
Home Financials for this Owner
Home Financials are based on the most recent Mortgage that was taken out on this home.
Original Mortgage
$122,450
Interest Rate
6.06%
Purchase Details
Closed on
Jan 14, 1999
Sold by
Foor Gail M
Bought by
Foor Gail M and Gail M Foor Revocable Trust
Purchase Details
Closed on
Jan 8, 1998
Sold by
Marcia Foor Gail
Bought by
Foor Gail M
Home Financials for this Owner
Home Financials are based on the most recent Mortgage that was taken out on this home.
Original Mortgage
$45,000
Interest Rate
6.66%
Purchase Details
Closed on
Jul 24, 1995
Sold by
Foor Gail Marcia
Bought by
Foor Gail M
Purchase Details
Closed on
Jun 27, 1995
Sold by
Foor Gail Marcia
Bought by
Foor Gail M
Create a Home Valuation Report for This Property
The Home Valuation Report is an in-depth analysis detailing your home's value as well as a comparison with similar homes in the area
Home Values in the Area
Average Home Value in this Area
Purchase History
| Date | Buyer | Sale Price | Title Company |
|---|---|---|---|
| Foor Gail M | -- | First American Title Co | |
| Foor Gail M | -- | First American Title Co | |
| Foor Gail M | -- | -- | |
| Foor Gail M | -- | Stewart Title | |
| Foor Gail M | -- | -- | |
| Foor Gail M | -- | -- |
Source: Public Records
Mortgage History
| Date | Status | Borrower | Loan Amount |
|---|---|---|---|
| Closed | Foor Gail M | $122,450 | |
| Closed | Foor Gail M | $45,000 |
Source: Public Records
Tax History Compared to Growth
Tax History
| Year | Tax Paid | Tax Assessment Tax Assessment Total Assessment is a certain percentage of the fair market value that is determined by local assessors to be the total taxable value of land and additions on the property. | Land | Improvement |
|---|---|---|---|---|
| 2025 | $2,012 | $143,971 | $55,967 | $88,004 |
| 2024 | $2,012 | $141,149 | $54,870 | $86,279 |
| 2023 | $1,921 | $138,382 | $53,794 | $84,588 |
| 2022 | $1,840 | $135,669 | $52,739 | $82,930 |
| 2021 | $1,786 | $133,009 | $51,705 | $81,304 |
| 2020 | $1,801 | $131,646 | $51,175 | $80,471 |
| 2019 | $1,762 | $129,065 | $50,171 | $78,894 |
| 2018 | $1,712 | $126,535 | $49,187 | $77,348 |
| 2017 | $1,659 | $124,054 | $48,222 | $75,832 |
| 2016 | $1,610 | $121,622 | $47,276 | $74,346 |
| 2015 | $1,468 | $119,796 | $46,566 | $73,230 |
| 2014 | $1,445 | $117,450 | $45,654 | $71,796 |
Source: Public Records
Map
Nearby Homes
- 34022 Selva Rd Unit 52
- 34014 Selva Rd Unit 18
- 12 Chelsea Pointe
- 34028 Selva Rd Unit 77
- 33925 Cape Cove
- 27 Palm Beach Ct
- 34132 Selva Rd Unit 252
- 5 Oceanfront Ln
- 11 Beach View Ave
- 1 Beach View Ave
- 35 Shoreline Dr
- 5 Pacific Ridge Place
- 31 Shoreline Dr
- 83 Palm Beach Ct
- 34365 Dana Strand Rd Unit 3
- 34381 Dana Strand Rd
- 23731 Montego Bay
- 17 Pacific Ridge Place
- 34385 Dana Strand Rd Unit B
- 33695 Crossjack Dr
- 34022 Selva Rd
- 34022 Selva Rd
- 34022 Selva Rd Unit 54
- 34022 Selva Rd Unit 49
- 34022 Selva Rd Unit 56
- 34022 Selva Rd Unit 55
- 34022 Selva Rd Unit 51
- 34022 Selva Rd Unit 53
- 34138 Selva Rd Unit 226
- 34138 Selva Rd Unit 225
- 34138 Selva Rd Unit 231
- 34138 Selva Rd Unit 232
- 34138 Selva Rd Unit 229
- 34138 Selva Rd Unit 228
- 34138 Selva Rd Unit 227
- 34138 Selva Rd Unit 230
- 34140 Selva Rd
- 34140 Selva Rd
- 34140 Selva Rd Unit 220
- 34140 Selva Rd Unit 222