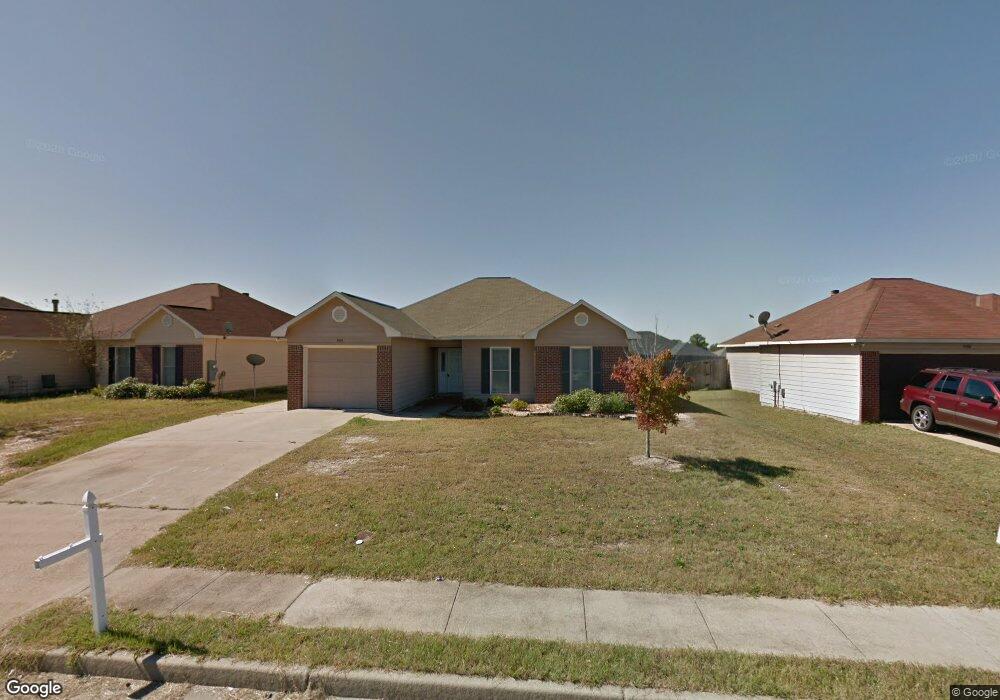
3404 Flintlock Dr Columbus, GA 31907
Eastern Columbus NeighborhoodEstimated Value: $174,534 - $190,000
4
Beds
2
Baths
1,370
Sq Ft
$133/Sq Ft
Est. Value
About This Home
This home is located at 3404 Flintlock Dr, Columbus, GA 31907 and is currently estimated at $182,884, approximately $133 per square foot. 3404 Flintlock Dr is a home located in Muscogee County with nearby schools including Forrest Road Elementary School, Fort Middle School, and Kendrick High School.
Ownership History
Date
Name
Owned For
Owner Type
Purchase Details
Closed on
May 24, 2019
Sold by
Vu Hai Duc
Bought by
Todd Vernita
Current Estimated Value
Home Financials for this Owner
Home Financials are based on the most recent Mortgage that was taken out on this home.
Original Mortgage
$104,802
Outstanding Balance
$92,142
Interest Rate
4.2%
Mortgage Type
New Conventional
Estimated Equity
$90,742
Purchase Details
Closed on
Mar 4, 2013
Sold by
Sec Of Veterans Affa
Bought by
Vu Hai Duc
Purchase Details
Closed on
Oct 2, 2012
Sold by
Phh Mtg Corp
Bought by
Sec Of Veterans Affairs
Purchase Details
Closed on
Feb 15, 2007
Sold by
Federal National Mortgage Association
Bought by
Montgomery Scott E
Home Financials for this Owner
Home Financials are based on the most recent Mortgage that was taken out on this home.
Original Mortgage
$134,900
Interest Rate
6.17%
Mortgage Type
VA
Create a Home Valuation Report for This Property
The Home Valuation Report is an in-depth analysis detailing your home's value as well as a comparison with similar homes in the area
Home Values in the Area
Average Home Value in this Area
Purchase History
| Date | Buyer | Sale Price | Title Company |
|---|---|---|---|
| Todd Vernita | $103,000 | -- | |
| Vu Hai Duc | $49,100 | -- | |
| Sec Of Veterans Affairs | $63,454 | -- | |
| Phh Mtg Corp | $63,454 | -- | |
| Montgomery Scott E | -- | None Available |
Source: Public Records
Mortgage History
| Date | Status | Borrower | Loan Amount |
|---|---|---|---|
| Open | Todd Vernita | $104,802 | |
| Previous Owner | Montgomery Scott E | $134,900 |
Source: Public Records
Tax History Compared to Growth
Tax History
| Year | Tax Paid | Tax Assessment Tax Assessment Total Assessment is a certain percentage of the fair market value that is determined by local assessors to be the total taxable value of land and additions on the property. | Land | Improvement |
|---|---|---|---|---|
| 2025 | $752 | $58,968 | $8,568 | $50,400 |
| 2024 | $752 | $58,968 | $8,568 | $50,400 |
| 2023 | $63 | $58,968 | $8,568 | $50,400 |
| 2022 | $784 | $49,940 | $8,568 | $41,372 |
| 2021 | $784 | $40,712 | $8,568 | $32,144 |
| 2020 | $785 | $40,712 | $8,568 | $32,144 |
| 2019 | $1,668 | $40,712 | $8,568 | $32,144 |
| 2018 | $1,668 | $40,712 | $8,568 | $32,144 |
| 2017 | $1,901 | $40,712 | $8,568 | $32,144 |
| 2016 | $1,364 | $33,055 | $7,200 | $25,855 |
| 2015 | $546 | $33,055 | $7,200 | $25,855 |
| 2014 | $812 | $19,640 | $7,200 | $12,440 |
| 2013 | $2,073 | $50,068 | $7,200 | $42,868 |
Source: Public Records
Map
Nearby Homes
- 6028 Caribou Dr
- 2672 Honeysuckle Dr
- 2942 Poppy Seed Loop
- 6000 Caribou Dr
- 3301 Musket Dr
- 3041 Waddell Dr
- 3027 Lansing Ave
- 2708 Courtland Ave
- 5906 Forrest Rd
- 6059 Nassau Cir
- 2940 Urban Ave
- 6636 Foxboro Dr
- 2525 Corineth Dr
- 5929 Gleneden Dr
- 6916 Bradshaw Dr
- 5920 Gleneden Dr
- 5642 Boby Dr
- 2807 Doyle Ave
- 5833 Gleneden Dr
- 5644 Peggy Dr
- 3408 Flintlock Dr
- 3400 Flintlock Dr
- 3412 Flintlock Dr
- 3396 Flintlock Dr
- 6127 Crossbow Dr
- 6131 Crossbow Dr
- 5017 Mint Dr
- 6125 Crossbow Dr
- 3416 Flintlock Dr
- 3392 Flintlock Dr
- 3407 Flintlock Dr
- 6133 Crossbow Dr
- 3411 Flintlock Dr
- 6123 Crossbow Dr
- 3415 Flintlock Dr
- 0 Flintlock Dr
- 3420 Flintlock Dr
- 5013 Mint Dr
- 3386 Flintlock Dr
- 6135 Crossbow Dr