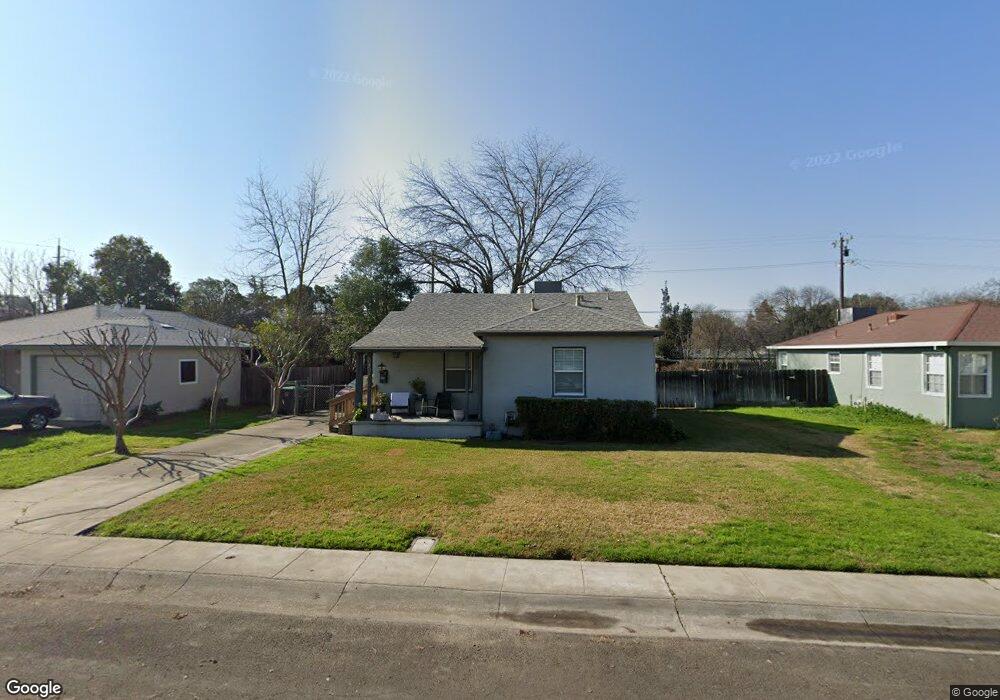
3405 Coronado Ave Stockton, CA 95204
Midtown NeighborhoodEstimated Value: $237,000 - $353,000
2
Beds
1
Bath
817
Sq Ft
$362/Sq Ft
Est. Value
About This Home
This home is located at 3405 Coronado Ave, Stockton, CA 95204 and is currently estimated at $295,425, approximately $361 per square foot. 3405 Coronado Ave is a home located in San Joaquin County with nearby schools including Harrison Elementary School, Grunsky Elementary School, and August Elementary School.
Ownership History
Date
Name
Owned For
Owner Type
Purchase Details
Closed on
Jun 24, 2019
Sold by
Ayson Sandra A
Bought by
Ayson Sandra A and The Sandra A Ayson Revocable T
Current Estimated Value
Home Financials for this Owner
Home Financials are based on the most recent Mortgage that was taken out on this home.
Original Mortgage
$151,000
Interest Rate
4%
Mortgage Type
New Conventional
Purchase Details
Closed on
Sep 25, 2015
Sold by
Ayson Sandra A
Bought by
Ayson Sandra A and The Sandra A Ayson Revocable T
Home Financials for this Owner
Home Financials are based on the most recent Mortgage that was taken out on this home.
Original Mortgage
$113,298
Interest Rate
4.12%
Mortgage Type
FHA
Purchase Details
Closed on
Feb 19, 2013
Sold by
Ayson Sandra A
Bought by
Ayson Sandra A and Sandra A Ayson Revocable Trust
Create a Home Valuation Report for This Property
The Home Valuation Report is an in-depth analysis detailing your home's value as well as a comparison with similar homes in the area
Home Values in the Area
Average Home Value in this Area
Purchase History
| Date | Buyer | Sale Price | Title Company |
|---|---|---|---|
| Ayson Sandra A | -- | Accommodation | |
| Ayson Sandra A | -- | Old Republic Title Co San | |
| Ayson Sandra A | -- | Chicago Title Agency | |
| Ayson Sandra A | -- | Chicago Title Agency | |
| Ayson Sandra A | -- | None Available |
Source: Public Records
Mortgage History
| Date | Status | Borrower | Loan Amount |
|---|---|---|---|
| Closed | Ayson Sandra A | $151,000 | |
| Closed | Ayson Sandra A | $113,298 |
Source: Public Records
Tax History Compared to Growth
Tax History
| Year | Tax Paid | Tax Assessment Tax Assessment Total Assessment is a certain percentage of the fair market value that is determined by local assessors to be the total taxable value of land and additions on the property. | Land | Improvement |
|---|---|---|---|---|
| 2025 | $1,668 | $126,468 | $60,659 | $65,809 |
| 2024 | $1,641 | $123,989 | $59,470 | $64,519 |
| 2023 | $1,605 | $121,558 | $58,304 | $63,254 |
| 2022 | $1,548 | $119,175 | $57,161 | $62,014 |
| 2021 | $1,490 | $116,840 | $56,041 | $60,799 |
| 2020 | $3,241 | $115,643 | $55,467 | $60,176 |
| 2019 | $1,423 | $113,377 | $54,380 | $58,997 |
| 2018 | $1,406 | $111,155 | $53,314 | $57,841 |
| 2017 | $1,333 | $108,976 | $52,269 | $56,707 |
| 2016 | $1,204 | $106,839 | $51,244 | $55,595 |
| 2015 | $1,352 | $105,234 | $50,474 | $54,760 |
| 2014 | $1,123 | $90,000 | $27,000 | $63,000 |
Source: Public Records
Map
Nearby Homes
- 3537 West Ln
- 3611 West Ln
- 3984 Monique Cir
- 3704 San Rafael Ave
- 3515 Carly Dr
- 705 E Barrymore St
- 746 Wright Ave
- 547 E Atlee St
- 480 E Monterey Ave
- 833 E Essex St
- 3605 Gloria Ct
- 467 E Churchill St
- 4233 Verdant St
- 2613 N California St
- 1771 Fontanella Way
- 314 E Mendocino Ave
- 243 E Stadium Dr
- 235 E Knoles Way
- The Discovery Plan at Calaveras Place
- 908 Terranova Ct
- 3415 Coronado Ave
- 3339 Coronado Ave
- 3425 Coronado Ave
- 3327 Coronado Ave
- 3406 Coronado Ave
- 3309 Coronado Ave
- 3435 Coronado Ave
- 3416 Coronado Ave
- 3336 Coronado Ave
- 3426 Coronado Ave
- 3326 Coronado Ave
- 3445 Coronado Ave
- 3307 Coronado Ave
- 3438 Coronado Ave
- 3314 Coronado Ave
- 3343 San Mateo Ave
- 3501 Coronado Ave
- 3415 San Mateo Ave
- 3335 San Mateo Ave
- 3343 San Mateo Ave