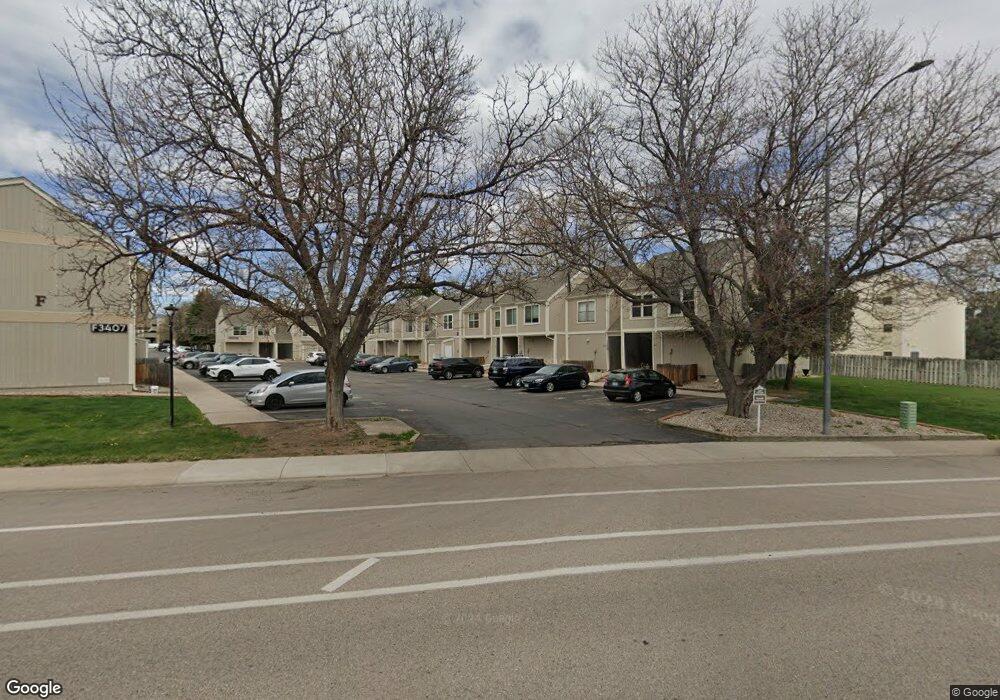
3407 Stover St Unit F613 Fort Collins, CO 80525
Estimated Value: $284,950 - $357,000
3
Beds
3
Baths
1,326
Sq Ft
$235/Sq Ft
Est. Value
About This Home
This home is located at 3407 Stover St Unit F613, Fort Collins, CO 80525 and is currently estimated at $311,988, approximately $235 per square foot. 3407 Stover St Unit F613 is a home located in Larimer County with nearby schools including O'Dea Elementary School, Boltz Middle School, and Fort Collins High School.
Ownership History
Date
Name
Owned For
Owner Type
Purchase Details
Closed on
Jun 30, 2006
Sold by
Charchalis Ann E and Charchalis Nicholas
Bought by
Peterson Paul F
Current Estimated Value
Home Financials for this Owner
Home Financials are based on the most recent Mortgage that was taken out on this home.
Original Mortgage
$114,660
Outstanding Balance
$66,058
Interest Rate
6.12%
Mortgage Type
Purchase Money Mortgage
Estimated Equity
$245,930
Purchase Details
Closed on
Aug 31, 2001
Sold by
Tappenden Darleen Ann
Bought by
Charchalis Ann E and Charchalis Nicholas
Home Financials for this Owner
Home Financials are based on the most recent Mortgage that was taken out on this home.
Original Mortgage
$97,200
Interest Rate
6.96%
Purchase Details
Closed on
Jan 28, 2000
Sold by
Windmill Apartments
Bought by
Tappenden Darleen Ann
Home Financials for this Owner
Home Financials are based on the most recent Mortgage that was taken out on this home.
Original Mortgage
$95,933
Interest Rate
7.95%
Create a Home Valuation Report for This Property
The Home Valuation Report is an in-depth analysis detailing your home's value as well as a comparison with similar homes in the area
Home Values in the Area
Average Home Value in this Area
Purchase History
| Date | Buyer | Sale Price | Title Company |
|---|---|---|---|
| Peterson Paul F | $127,400 | Fahtco | |
| Charchalis Ann E | $108,000 | -- | |
| Tappenden Darleen Ann | $98,900 | -- |
Source: Public Records
Mortgage History
| Date | Status | Borrower | Loan Amount |
|---|---|---|---|
| Open | Peterson Paul F | $114,660 | |
| Previous Owner | Charchalis Ann E | $97,200 | |
| Previous Owner | Tappenden Darleen Ann | $95,933 |
Source: Public Records
Tax History Compared to Growth
Tax History
| Year | Tax Paid | Tax Assessment Tax Assessment Total Assessment is a certain percentage of the fair market value that is determined by local assessors to be the total taxable value of land and additions on the property. | Land | Improvement |
|---|---|---|---|---|
| 2025 | $1,736 | $21,782 | $4,489 | $17,293 |
| 2024 | $1,652 | $21,782 | $4,489 | $17,293 |
| 2022 | $1,640 | $17,369 | $1,738 | $15,631 |
| 2021 | $1,657 | $17,868 | $1,788 | $16,080 |
| 2020 | $1,476 | $15,773 | $1,788 | $13,985 |
| 2019 | $1,482 | $15,773 | $1,788 | $13,985 |
| 2018 | $1,450 | $15,905 | $1,800 | $14,105 |
| 2017 | $1,445 | $15,905 | $1,800 | $14,105 |
| 2016 | $1,010 | $11,064 | $1,990 | $9,074 |
| 2015 | $1,003 | $11,060 | $1,990 | $9,070 |
| 2014 | $932 | $10,220 | $1,990 | $8,230 |
Source: Public Records
Map
Nearby Homes
- 3431 Stover St Unit E513
- 3431 Stover St Unit E523
- 3400 Stanford Rd Unit A120
- 729 Parkview Dr
- 717 Parkview Dr
- 3248 Camelot Dr
- 949 Kingston Dr
- 413 Spinnaker Ln
- 1012 Driftwood Dr
- 809 Oxford Ln
- 1101 Mansfield Dr
- 1045 Driftwood Dr
- 1024 E Swallow Rd Unit B214
- 1024 E Swallow Rd Unit B233
- 3031 Eastborough Dr
- 1001 Strachan Dr Unit 22
- 705 E Drake Rd Unit O35
- 705 E Drake Rd Unit Q22
- 1219 Mansfield Dr
- 1024 Oxford Ln Unit 52
- 3407 Stover St Unit H817
- 3407 Stover St Unit H816
- 3407 Stover St Unit H815
- 3407 Stover St Unit H814
- 3407 Stover St Unit H813
- 3407 Stover St Unit H812
- 3407 Stover St Unit H811
- 3407 Stover St Unit H810
- 3407 Stover St Unit G713
- 3407 Stover St Unit G712
- 3407 Stover St Unit G711
- 3407 Stover St Unit G710
- 3407 Stover St Unit F616
- 3407 Stover St Unit F615
- 3407 Stover St Unit F614
- 3407 Stover St Unit F612
- 3407 Stover St Unit F611
- 3407 Stover St Unit F610
- 3407 Stover St
- 3407 Stover St Unit FF-611