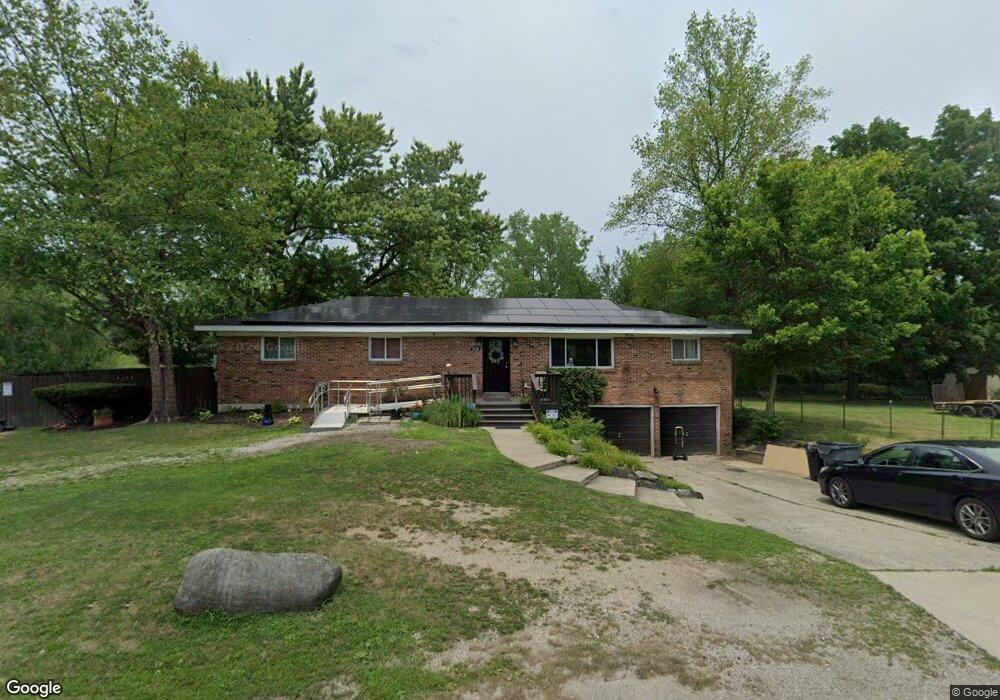
3408 Brookside Blvd Columbus, OH 43204
Scioto Woods NeighborhoodEstimated Value: $179,000 - $259,000
3
Beds
2
Baths
1,440
Sq Ft
$160/Sq Ft
Est. Value
About This Home
This home is located at 3408 Brookside Blvd, Columbus, OH 43204 and is currently estimated at $231,009, approximately $160 per square foot. 3408 Brookside Blvd is a home located in Franklin County with nearby schools including Prairie Lincoln Elementary School, Galloway Ridge Intermediate School, and Norton Middle School.
Ownership History
Date
Name
Owned For
Owner Type
Purchase Details
Closed on
May 12, 2021
Sold by
Pennington Colleen
Bought by
Pennington Colleen and Pennington Kenneth
Current Estimated Value
Home Financials for this Owner
Home Financials are based on the most recent Mortgage that was taken out on this home.
Original Mortgage
$76,500
Outstanding Balance
$52,723
Interest Rate
2.8%
Mortgage Type
New Conventional
Estimated Equity
$178,286
Purchase Details
Closed on
Feb 17, 2000
Sold by
Pennington Phillip and Pennington Sabera Lucille
Bought by
Pennington Colleen
Home Financials for this Owner
Home Financials are based on the most recent Mortgage that was taken out on this home.
Original Mortgage
$50,000
Interest Rate
11.12%
Mortgage Type
Purchase Money Mortgage
Purchase Details
Closed on
May 19, 1978
Bought by
Pennington Phillip
Create a Home Valuation Report for This Property
The Home Valuation Report is an in-depth analysis detailing your home's value as well as a comparison with similar homes in the area
Home Values in the Area
Average Home Value in this Area
Purchase History
| Date | Buyer | Sale Price | Title Company |
|---|---|---|---|
| Pennington Colleen | -- | Vylla Title Llc | |
| Pennington Colleen | -- | -- | |
| Pennington Phillip | -- | -- |
Source: Public Records
Mortgage History
| Date | Status | Borrower | Loan Amount |
|---|---|---|---|
| Open | Pennington Colleen | $76,500 | |
| Closed | Pennington Colleen | $50,000 |
Source: Public Records
Tax History
| Year | Tax Paid | Tax Assessment Tax Assessment Total Assessment is a certain percentage of the fair market value that is determined by local assessors to be the total taxable value of land and additions on the property. | Land | Improvement |
|---|---|---|---|---|
| 2025 | $2,699 | $52,920 | $12,250 | $40,670 |
| 2024 | $2,699 | $52,920 | $12,250 | $40,670 |
| 2023 | $2,685 | $52,920 | $12,250 | $40,670 |
| 2022 | $3,443 | $46,660 | $8,090 | $38,570 |
| 2021 | $3,271 | $46,660 | $8,090 | $38,570 |
| 2020 | $3,265 | $46,660 | $8,090 | $38,570 |
| 2019 | $2,914 | $37,350 | $6,480 | $30,870 |
| 2018 | $2,596 | $37,350 | $6,480 | $30,870 |
| 2017 | $2,677 | $37,350 | $6,480 | $30,870 |
| 2016 | $2,467 | $29,930 | $5,220 | $24,710 |
| 2015 | $2,290 | $29,930 | $5,220 | $24,710 |
| 2014 | $2,292 | $29,930 | $5,220 | $24,710 |
| 2013 | $2,499 | $33,215 | $5,775 | $27,440 |
Source: Public Records
Map
Nearby Homes
- 3271 Dover Rd
- 3079 Jersey Dr Unit 75
- 3791 Farm Brook Ln
- 1350 Baja Ln Unit 10
- 3332 Timber Oak Dr
- 3996 Deer Lake Way
- 1593 Raspberry Run Dr
- 0 Fisher Rd
- 3691 Cannongate Dr
- 2176 Bigby Hollow St
- 3985 Spyglass Dr
- 2700 Mc Kinley Ave
- 3870 Cypress Creek Dr
- 471 N Hague Ave
- 1214 Lake Shore Dr Unit C
- 2022 Lake Shore Dr
- 2288 Quarry Trails Dr
- 2290 Quarry Trails Dr
- 1407 Lake Shore Dr Unit 139
- 2250 Quarry Trails Dr
- 3382 Brookside Blvd
- 3420 Brookside Blvd
- 3360 Brookside Blvd
- 3403 Brookside Blvd
- 3411 Brookside Blvd
- 3419 Brookside Blvd
- 3383 Brookside Blvd
- 3365 Brookside Blvd
- 3365 Brookside Blvd
- 3437 Brookside Blvd
- 3450 Brookside Blvd
- 3447 Brookside Blvd
- 3460 Brookside Blvd
- 3351 Brookside Blvd
- 3382 Dover Rd
- 3400 Dover Rd
- 3410 Dover Rd
- 3451 Brookside Blvd
- 3350 Brookside Blvd
- 3468 Brookside Blvd
Your Personal Tour Guide
Ask me questions while you tour the home.