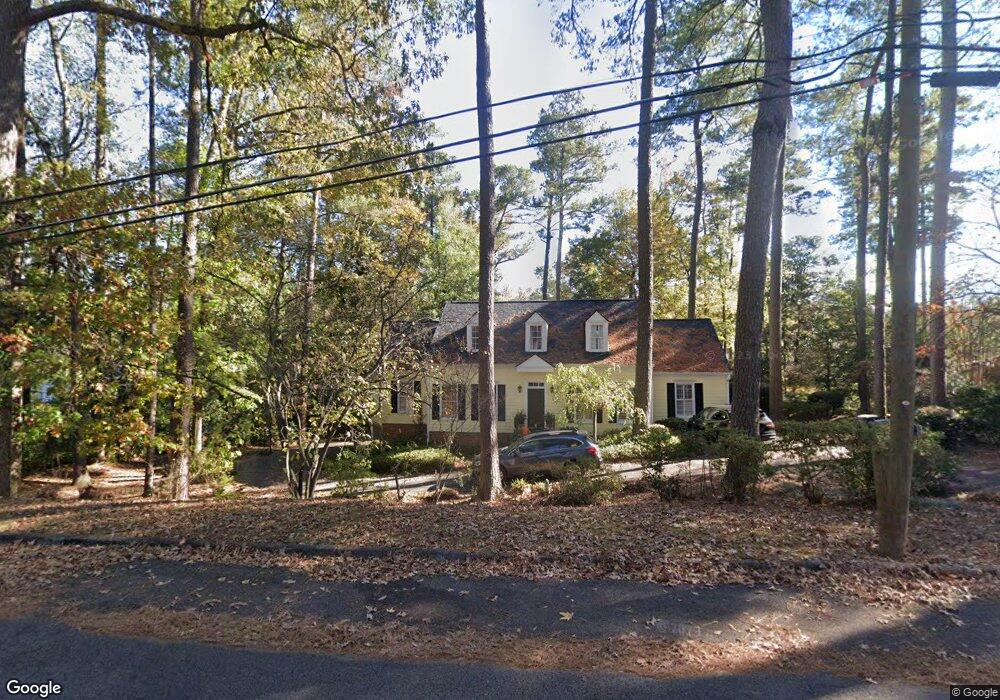
3408 Sasanqua Dr Augusta, GA 30909
Lake Aumond NeighborhoodEstimated Value: $398,520 - $579,000
3
Beds
3
Baths
2,785
Sq Ft
$178/Sq Ft
Est. Value
About This Home
This home is located at 3408 Sasanqua Dr, Augusta, GA 30909 and is currently estimated at $495,630, approximately $177 per square foot. 3408 Sasanqua Dr is a home located in Richmond County with nearby schools including Lake Forest Hills Elementary School, Tutt Middle School, and Johnson Magnet.
Ownership History
Date
Name
Owned For
Owner Type
Purchase Details
Closed on
Oct 18, 2010
Sold by
Broome Mary W
Bought by
Broome Matthew
Current Estimated Value
Home Financials for this Owner
Home Financials are based on the most recent Mortgage that was taken out on this home.
Original Mortgage
$195,500
Outstanding Balance
$102,309
Interest Rate
4.39%
Mortgage Type
New Conventional
Estimated Equity
$393,321
Purchase Details
Closed on
Oct 17, 2005
Sold by
Hanson Judith J
Bought by
Broome Matthew and Broome Mary Wallace
Home Financials for this Owner
Home Financials are based on the most recent Mortgage that was taken out on this home.
Original Mortgage
$208,000
Interest Rate
5.71%
Mortgage Type
Fannie Mae Freddie Mac
Purchase Details
Closed on
Jan 20, 1997
Sold by
Hanson Thomas A
Bought by
Hanson Judith J
Purchase Details
Closed on
Jun 1, 1976
Create a Home Valuation Report for This Property
The Home Valuation Report is an in-depth analysis detailing your home's value as well as a comparison with similar homes in the area
Home Values in the Area
Average Home Value in this Area
Purchase History
| Date | Buyer | Sale Price | Title Company |
|---|---|---|---|
| Broome Matthew | -- | -- | |
| Broome Matthew | $260,000 | -- | |
| Hanson Judith J | -- | -- | |
| -- | $12,200 | -- |
Source: Public Records
Mortgage History
| Date | Status | Borrower | Loan Amount |
|---|---|---|---|
| Open | Broome Matthew | $195,500 | |
| Previous Owner | Broome Matthew | $208,000 |
Source: Public Records
Tax History
| Year | Tax Paid | Tax Assessment Tax Assessment Total Assessment is a certain percentage of the fair market value that is determined by local assessors to be the total taxable value of land and additions on the property. | Land | Improvement |
|---|---|---|---|---|
| 2025 | $4,351 | $144,432 | $16,000 | $128,432 |
| 2024 | $4,351 | $148,488 | $16,000 | $132,488 |
| 2023 | $4,372 | $141,772 | $16,000 | $125,772 |
| 2022 | $3,267 | $102,542 | $16,000 | $86,542 |
| 2021 | $3,185 | $90,749 | $16,000 | $74,749 |
| 2020 | $2,927 | $83,954 | $16,000 | $67,954 |
| 2019 | $3,112 | $83,954 | $16,000 | $67,954 |
| 2018 | $3,135 | $83,954 | $16,000 | $67,954 |
| 2017 | $3,115 | $83,954 | $16,000 | $67,954 |
| 2016 | $3,117 | $83,954 | $16,000 | $67,954 |
| 2015 | $3,140 | $83,954 | $16,000 | $67,954 |
| 2014 | $3,144 | $83,954 | $16,000 | $67,954 |
Source: Public Records
Map
Nearby Homes
- 3413 Kerry Place
- 855 Wimbledon Dr
- 3205 N Wimbledon Dr
- 4224 Match Point Dr
- 828 Dogwood Ln
- 755 Tripps Ct
- 3506 Jamaica Dr
- 3427 Heather Dr
- 12 Summerville Ln
- 1408 Jackson Rd
- 3515 Jamaica Dr
- 3518 Nassau Dr
- 3221 Alpine Rd
- 802 Camellia Rd
- 3602 Nassau Dr
- 778 Camellia Rd
- 6 Tall Pine Cir
- 0 Wheeler Rd
- 3509 Nassau Dr
- 3341 Oakridge Dr
- 3410 Sasanqua Dr
- 3407 Kerry Place
- 3404 Sasanqua Dr
- 3409 Kerry Place
- 3405 Kerry Place
- 3405 Sasanqua Dr
- 3407 Sasanqua Dr
- 3411 Kerry Place
- 3403 Kerry Place
- 3403 Sasanqua Dr
- 3412 Sasanqua Dr
- 3409 Sasanqua Dr
- 3402 Sasanqua Dr
- 3112 W Lake Forest Dr
- 3411 Sasanqua Dr
- 3412 Kerry Place
- 3406 Kamel Cir
- 3401 Kerry Place
- 3118 W Lake Forest Dr
- 3408 Kamel Cir
Your Personal Tour Guide
Ask me questions while you tour the home.