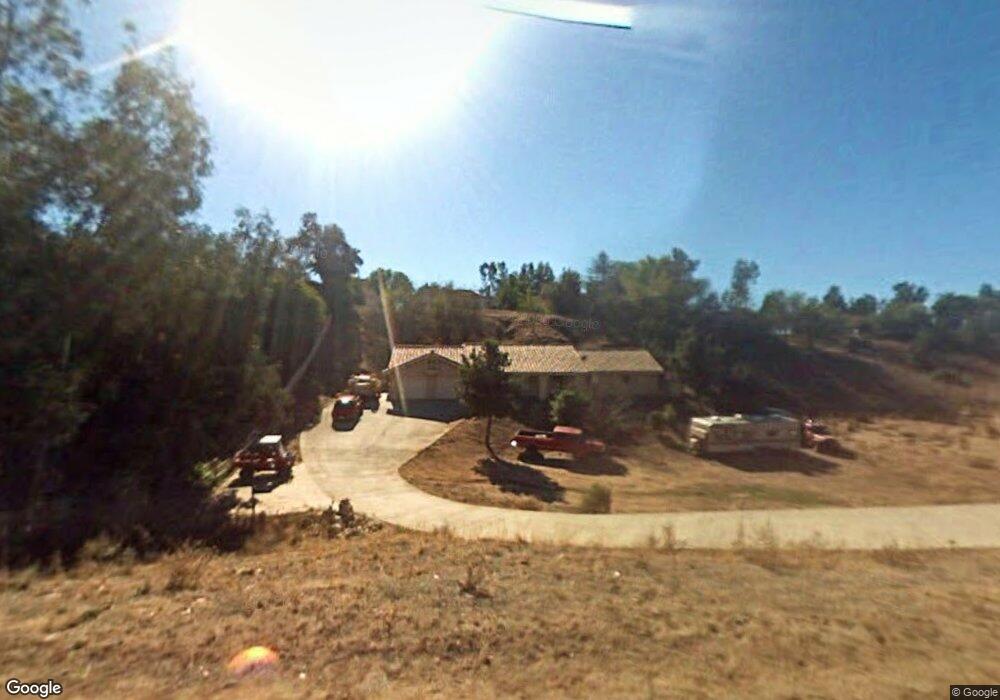
34089 5th Place Yucaipa, CA 92399
Estimated Value: $559,000 - $655,000
3
Beds
2
Baths
1,755
Sq Ft
$348/Sq Ft
Est. Value
About This Home
This home is located at 34089 5th Place, Yucaipa, CA 92399 and is currently estimated at $611,495, approximately $348 per square foot. 34089 5th Place is a home located in San Bernardino County with nearby schools including Calimesa Elementary, Mesa View Middle School, and Yucaipa High School.
Ownership History
Date
Name
Owned For
Owner Type
Purchase Details
Closed on
Dec 31, 2024
Sold by
Judy Sandra Foster Declaration Of Trust and Foster Judy Sandra
Bought by
Fonseca Dean and Fonseca Katrina
Current Estimated Value
Home Financials for this Owner
Home Financials are based on the most recent Mortgage that was taken out on this home.
Original Mortgage
$486,765
Outstanding Balance
$483,404
Interest Rate
6.84%
Mortgage Type
New Conventional
Estimated Equity
$128,091
Purchase Details
Closed on
Jun 18, 2020
Sold by
Foster Judy Sandra and Foster Judy Sandra
Bought by
Foster Judy Sandra and Foster Judy Sandra
Purchase Details
Closed on
Jul 29, 2013
Sold by
East Island Ltd
Bought by
Crystal Springs Trust
Purchase Details
Closed on
Dec 4, 1995
Sold by
Estrada Luis M and Estrada Sandra J
Bought by
East Island Ltd
Create a Home Valuation Report for This Property
The Home Valuation Report is an in-depth analysis detailing your home's value as well as a comparison with similar homes in the area
Home Values in the Area
Average Home Value in this Area
Purchase History
| Date | Buyer | Sale Price | Title Company |
|---|---|---|---|
| Fonseca Dean | $541,000 | None Listed On Document | |
| Fonseca Dean | $541,000 | None Listed On Document | |
| Foster Judy Sandra | -- | None Available | |
| Crystal Springs Trust | -- | None Available | |
| East Island Ltd | $155,982 | Chicago Title Co |
Source: Public Records
Mortgage History
| Date | Status | Borrower | Loan Amount |
|---|---|---|---|
| Open | Fonseca Dean | $486,765 | |
| Closed | Fonseca Dean | $486,765 |
Source: Public Records
Tax History
| Year | Tax Paid | Tax Assessment Tax Assessment Total Assessment is a certain percentage of the fair market value that is determined by local assessors to be the total taxable value of land and additions on the property. | Land | Improvement |
|---|---|---|---|---|
| 2025 | $4,200 | $312,596 | $91,940 | $220,656 |
| 2024 | $4,080 | $306,466 | $90,137 | $216,329 |
| 2023 | $3,974 | $300,457 | $88,370 | $212,087 |
| 2022 | $3,912 | $294,565 | $86,637 | $207,928 |
| 2021 | $3,845 | $288,789 | $84,938 | $203,851 |
| 2020 | $3,771 | $285,828 | $84,067 | $201,761 |
| 2019 | $3,649 | $280,224 | $82,419 | $197,805 |
| 2018 | $3,336 | $274,729 | $80,803 | $193,926 |
| 2017 | $3,263 | $269,343 | $79,219 | $190,124 |
| 2016 | $3,220 | $264,062 | $77,666 | $186,396 |
| 2015 | $3,401 | $260,095 | $76,499 | $183,596 |
| 2014 | $3,338 | $255,000 | $75,000 | $180,000 |
Source: Public Records
Map
Nearby Homes
- 34077 5th Place
- 13376 Robin Ct
- 34111 Wildwood Canyon Rd Unit 136
- 34111 Wildwood Canyon Rd Unit 58
- 13346 Rimview Ct
- 13170 6th Place
- 34334 La Raye Dr
- 33848 Avenue G
- 13590 Meadow St
- 34385 Avenue H
- 12995 6th St
- 13615 5th St
- 12946 5th St
- 33817 Liberty Rd
- 12896 Emerald Bay Ct
- 912 Avenue B
- 13645 5th #73 St
- 33600 Calimesa Blvd Unit 111
- 33600 Calimesa Blvd Unit 55
- 0 Erwin St
Your Personal Tour Guide
Ask me questions while you tour the home.