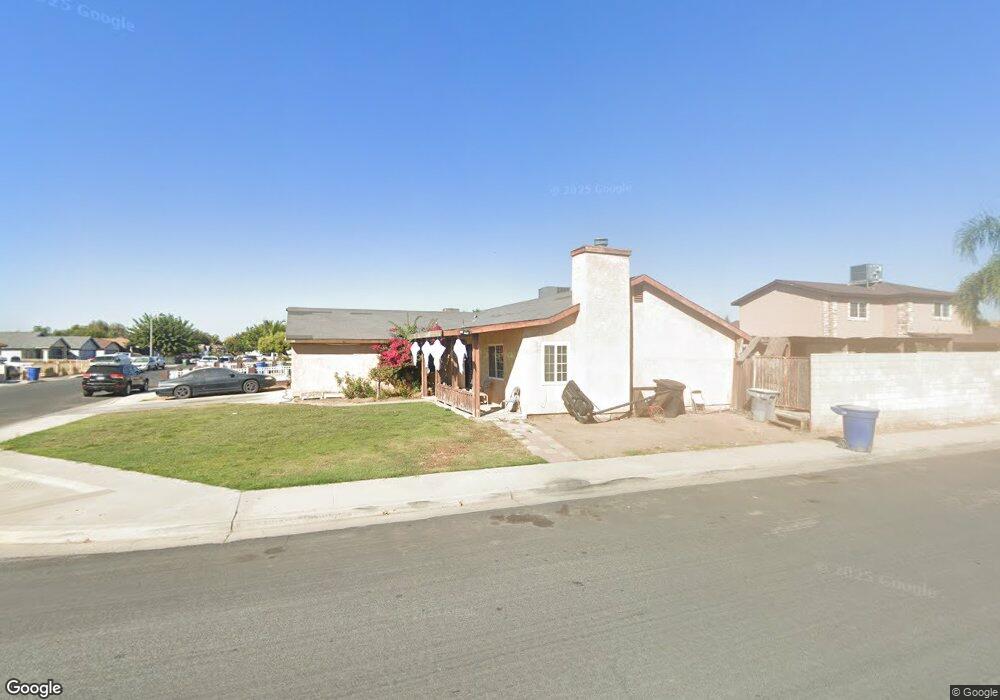
341 Balboa Dr Delano, CA 93215
West Delano NeighborhoodEstimated Value: $285,000 - $338,000
3
Beds
2
Baths
1,296
Sq Ft
$244/Sq Ft
Est. Value
About This Home
This home is located at 341 Balboa Dr, Delano, CA 93215 and is currently estimated at $315,701, approximately $243 per square foot. 341 Balboa Dr is a home located in Kern County with nearby schools including Almond Tree Middle School, Cesar E. Chavez High School, and Nueva Vista Language Academy.
Ownership History
Date
Name
Owned For
Owner Type
Purchase Details
Closed on
Nov 3, 2011
Sold by
The Secretary Of Housing Urban Developme
Bought by
Larios Graciela Pimentel
Current Estimated Value
Home Financials for this Owner
Home Financials are based on the most recent Mortgage that was taken out on this home.
Original Mortgage
$90,496
Outstanding Balance
$62,391
Interest Rate
4.25%
Mortgage Type
FHA
Estimated Equity
$253,310
Purchase Details
Closed on
Oct 26, 2010
Sold by
Citimortgage Inc
Bought by
The Secretary Of Housing & Urban Develop
Purchase Details
Closed on
Oct 25, 2010
Sold by
Puentes Victor H and Puentes Estela
Bought by
Moenopoly Inc
Purchase Details
Closed on
May 2, 2006
Sold by
Huerta Estela
Bought by
Puentes Victor H and Puentes Estela
Home Financials for this Owner
Home Financials are based on the most recent Mortgage that was taken out on this home.
Original Mortgage
$216,601
Interest Rate
6.46%
Mortgage Type
FHA
Purchase Details
Closed on
Apr 18, 2006
Sold by
Huerta Estela and Puentes Victor H
Bought by
Huerta Estela
Home Financials for this Owner
Home Financials are based on the most recent Mortgage that was taken out on this home.
Original Mortgage
$216,601
Interest Rate
6.46%
Mortgage Type
FHA
Purchase Details
Closed on
Feb 22, 2006
Sold by
Huerta Estela
Bought by
Huerta Estela and Puentes Victor H
Purchase Details
Closed on
Jan 21, 2005
Sold by
Vazquez Miguel Sanchez
Bought by
Huerta Estela
Home Financials for this Owner
Home Financials are based on the most recent Mortgage that was taken out on this home.
Original Mortgage
$136,000
Interest Rate
6.87%
Mortgage Type
Purchase Money Mortgage
Purchase Details
Closed on
May 25, 1999
Sold by
Dela Cerda Arturo and Dela Ignacia
Bought by
Garza Gregorio and Garza Asencion
Home Financials for this Owner
Home Financials are based on the most recent Mortgage that was taken out on this home.
Original Mortgage
$89,162
Interest Rate
7.4%
Mortgage Type
FHA
Purchase Details
Closed on
Oct 4, 1994
Sold by
Western Builders
Bought by
Delacerda Arturo and Delacerda Ignacia
Home Financials for this Owner
Home Financials are based on the most recent Mortgage that was taken out on this home.
Original Mortgage
$88,230
Interest Rate
8.7%
Mortgage Type
VA
Purchase Details
Closed on
Feb 7, 1994
Sold by
Kay Raymond H and Kay Thelma A
Bought by
Western Builders
Create a Home Valuation Report for This Property
The Home Valuation Report is an in-depth analysis detailing your home's value as well as a comparison with similar homes in the area
Home Values in the Area
Average Home Value in this Area
Purchase History
| Date | Buyer | Sale Price | Title Company |
|---|---|---|---|
| Larios Graciela Pimentel | $103,000 | Chicago Title Company | |
| The Secretary Of Housing & Urban Develop | -- | Cr Title Services Inc | |
| Citimortgage Inc | $248,356 | Cr Title Services Inc | |
| Moenopoly Inc | -- | None Available | |
| Puentes Victor H | $220,000 | Alliance Title Company | |
| Huerta Estela | -- | None Available | |
| Huerta Estela | -- | First American Title Company | |
| Huerta Estela | -- | Alliance Title | |
| Huerta Estela | $170,000 | Alliance Title | |
| Garza Gregorio | $89,500 | -- | |
| Delacerda Arturo | $86,500 | Commonwealth Land Title Co | |
| Western Builders | $20,000 | Commonwealth Land Title Ins |
Source: Public Records
Mortgage History
| Date | Status | Borrower | Loan Amount |
|---|---|---|---|
| Open | Larios Graciela Pimentel | $90,496 | |
| Previous Owner | Puentes Victor H | $216,601 | |
| Previous Owner | Huerta Estela | $136,000 | |
| Previous Owner | Garza Gregorio | $89,162 | |
| Previous Owner | Delacerda Arturo | $88,230 | |
| Closed | Garza Gregorio | $4,465 | |
| Closed | Huerta Estela | $34,000 |
Source: Public Records
Tax History
| Year | Tax Paid | Tax Assessment Tax Assessment Total Assessment is a certain percentage of the fair market value that is determined by local assessors to be the total taxable value of land and additions on the property. | Land | Improvement |
|---|---|---|---|---|
| 2025 | $1,633 | $129,362 | $25,114 | $104,248 |
| 2024 | $1,588 | $126,826 | $24,622 | $102,204 |
| 2023 | $1,588 | $124,340 | $24,140 | $100,200 |
| 2022 | $1,560 | $121,903 | $23,667 | $98,236 |
| 2021 | $1,492 | $119,513 | $23,203 | $96,310 |
| 2020 | $1,487 | $118,289 | $22,966 | $95,323 |
| 2019 | $1,462 | $118,289 | $22,966 | $95,323 |
| 2018 | $1,444 | $113,697 | $22,075 | $91,622 |
| 2017 | $1,453 | $111,469 | $21,643 | $89,826 |
| 2016 | $1,430 | $109,284 | $21,219 | $88,065 |
| 2015 | $1,477 | $107,644 | $20,901 | $86,743 |
| 2014 | $1,382 | $105,536 | $20,492 | $85,044 |
Source: Public Records
Map
Nearby Homes
- 209 S Belmont St
- 123 Dover St
- 328 Dover Place
- 121 Glenwood St
- 125 Glenwood St
- 420 Dover Place
- 339 Glenwood St
- 432 Dover Place
- 609 Dover St
- 602 Dover Place
- 334 Albany St
- 430 Fremont St
- 622 Dover St
- 119 S Lexington St
- 529 Main St
- 901 Belmont St
- 0 S High St
- 718 Florito Way
- 11237 Stradley Ave
- 814 Encanto Way
- 337 Balboa Dr Unit 1
- 205 S Clinton St Unit A
- 2310 Ponce de Leon Dr
- 401 Balboa Dr Unit 1
- 331 Balboa Dr
- 201 S Clinton St
- 340 Balboa Dr
- 400 Alhambra Ave
- 328 Alhambra Place
- 336 Balboa Dr
- 405 Balboa Dr Unit 1
- 327 Balboa Dr Unit 1
- 402 Balboa Dr
- 330 Balboa Dr
- 332 Alhambra Place
- 105 S Clinton St
- 404 Alhambra Ave
- 406 Balboa Dr
- 409 Balboa Dr Unit 1
- 326 Balboa Dr Unit 1
Your Personal Tour Guide
Ask me questions while you tour the home.