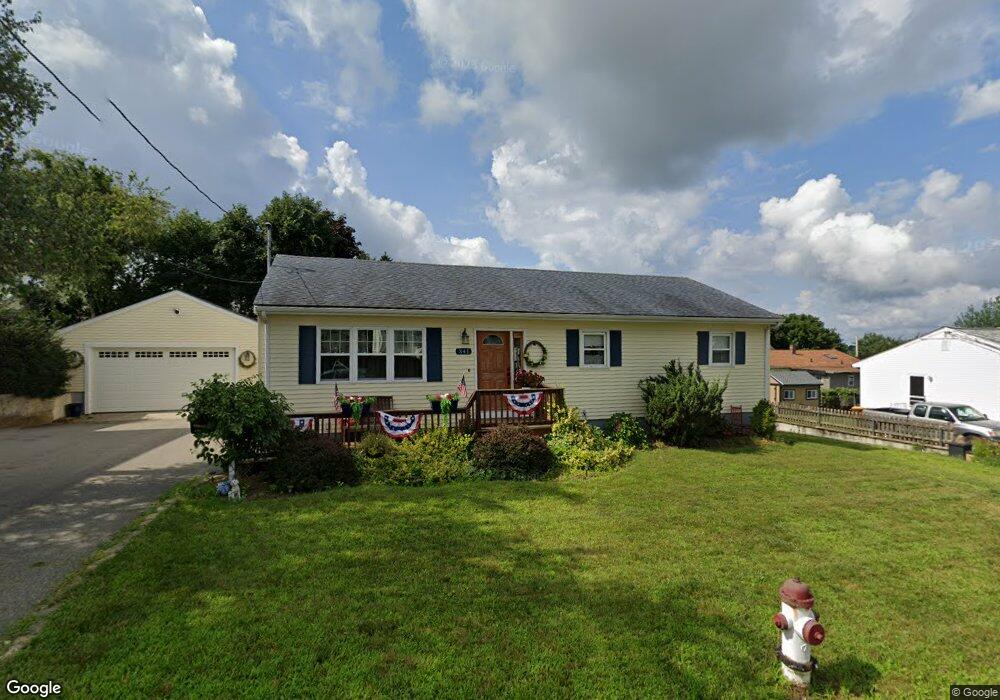
341 Embert St Fall River, MA 02721
Maplewood NeighborhoodEstimated Value: $402,000 - $449,000
3
Beds
2
Baths
1,674
Sq Ft
$256/Sq Ft
Est. Value
About This Home
This home is located at 341 Embert St, Fall River, MA 02721 and is currently estimated at $428,581, approximately $256 per square foot. 341 Embert St is a home located in Bristol County with nearby schools including Letourneau Elementary School, Matthew J. Kuss Middle School, and B M C Durfee High School.
Ownership History
Date
Name
Owned For
Owner Type
Purchase Details
Closed on
Sep 21, 2001
Sold by
Pinault Adelia
Bought by
Schieri Vincent F and Schieri Brenda L
Current Estimated Value
Home Financials for this Owner
Home Financials are based on the most recent Mortgage that was taken out on this home.
Original Mortgage
$147,500
Interest Rate
6.98%
Mortgage Type
Purchase Money Mortgage
Create a Home Valuation Report for This Property
The Home Valuation Report is an in-depth analysis detailing your home's value as well as a comparison with similar homes in the area
Home Values in the Area
Average Home Value in this Area
Purchase History
| Date | Buyer | Sale Price | Title Company |
|---|---|---|---|
| Schieri Vincent F | $155,500 | -- |
Source: Public Records
Mortgage History
| Date | Status | Borrower | Loan Amount |
|---|---|---|---|
| Open | Schieri Vincent F | $125,000 | |
| Closed | Schieri Vincent F | $147,500 |
Source: Public Records
Tax History
| Year | Tax Paid | Tax Assessment Tax Assessment Total Assessment is a certain percentage of the fair market value that is determined by local assessors to be the total taxable value of land and additions on the property. | Land | Improvement |
|---|---|---|---|---|
| 2025 | $4,285 | $374,200 | $119,400 | $254,800 |
| 2024 | $4,030 | $350,700 | $117,000 | $233,700 |
| 2023 | $3,994 | $325,500 | $105,400 | $220,100 |
| 2022 | $3,545 | $280,900 | $99,500 | $181,400 |
| 2021 | $3,329 | $240,700 | $95,000 | $145,700 |
| 2020 | $3,319 | $229,700 | $90,700 | $139,000 |
| 2019 | $3,279 | $224,900 | $94,800 | $130,100 |
| 2018 | $3,266 | $223,400 | $95,500 | $127,900 |
| 2017 | $3,100 | $221,400 | $95,500 | $125,900 |
| 2016 | $2,981 | $218,700 | $98,400 | $120,300 |
| 2015 | $2,899 | $221,600 | $98,400 | $123,200 |
| 2014 | $2,788 | $221,600 | $98,400 | $123,200 |
Source: Public Records
Map
Nearby Homes
Your Personal Tour Guide
Ask me questions while you tour the home.