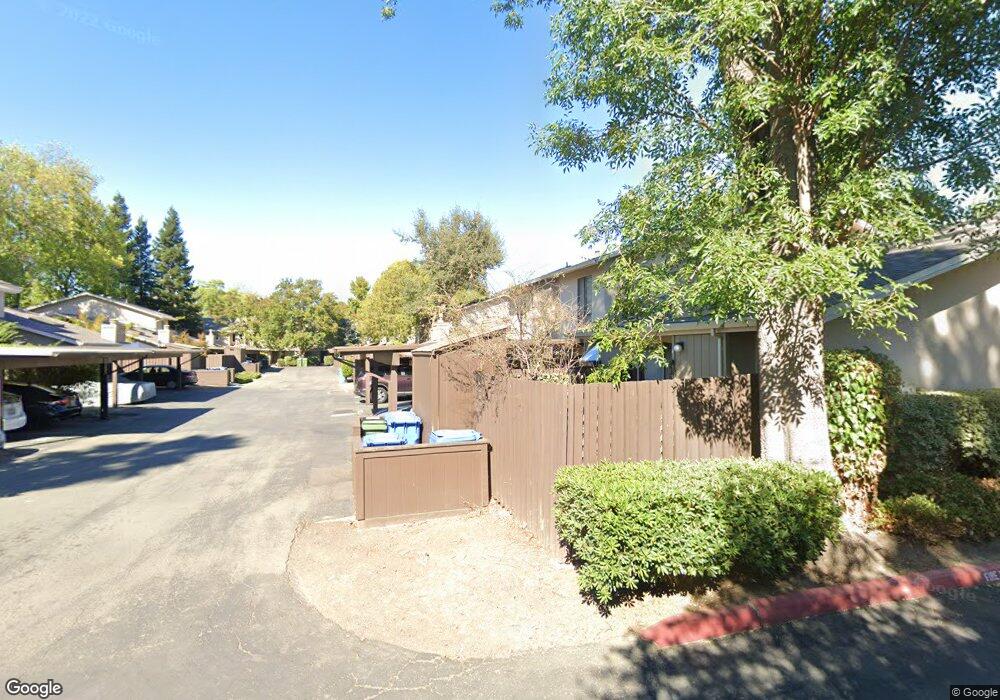
341 Westcliffe Cir Walnut Creek, CA 94597
Contra Costa Centre NeighborhoodEstimated Value: $469,699 - $614,000
2
Beds
1
Bath
873
Sq Ft
$647/Sq Ft
Est. Value
About This Home
This home is located at 341 Westcliffe Cir, Walnut Creek, CA 94597 and is currently estimated at $564,925, approximately $647 per square foot. 341 Westcliffe Cir is a home located in Contra Costa County with nearby schools including Indian Valley Elementary School, Walnut Creek Intermediate School, and Las Lomas High School.
Ownership History
Date
Name
Owned For
Owner Type
Purchase Details
Closed on
Jun 20, 2001
Sold by
Jeremiason Stacey L and Jermemiason Stacey J
Bought by
Karamichev Dimitar S and Karamicheva Nadia
Current Estimated Value
Home Financials for this Owner
Home Financials are based on the most recent Mortgage that was taken out on this home.
Original Mortgage
$213,600
Outstanding Balance
$81,364
Interest Rate
7.14%
Mortgage Type
Purchase Money Mortgage
Estimated Equity
$483,561
Purchase Details
Closed on
Feb 13, 1998
Sold by
Rohwedder Cedric T
Bought by
Jeremiason Stacey J
Home Financials for this Owner
Home Financials are based on the most recent Mortgage that was taken out on this home.
Original Mortgage
$118,800
Interest Rate
6.97%
Mortgage Type
Purchase Money Mortgage
Create a Home Valuation Report for This Property
The Home Valuation Report is an in-depth analysis detailing your home's value as well as a comparison with similar homes in the area
Home Values in the Area
Average Home Value in this Area
Purchase History
| Date | Buyer | Sale Price | Title Company |
|---|---|---|---|
| Karamichev Dimitar S | $267,000 | Chicago Title Co | |
| Jeremiason Stacey J | $148,500 | North American Title Co |
Source: Public Records
Mortgage History
| Date | Status | Borrower | Loan Amount |
|---|---|---|---|
| Open | Karamichev Dimitar S | $213,600 | |
| Previous Owner | Jeremiason Stacey J | $118,800 | |
| Closed | Jeremiason Stacey J | $25,245 |
Source: Public Records
Tax History Compared to Growth
Tax History
| Year | Tax Paid | Tax Assessment Tax Assessment Total Assessment is a certain percentage of the fair market value that is determined by local assessors to be the total taxable value of land and additions on the property. | Land | Improvement |
|---|---|---|---|---|
| 2025 | $5,431 | $402,306 | $195,878 | $206,428 |
| 2024 | $5,431 | $394,419 | $192,038 | $202,381 |
| 2023 | $5,300 | $386,686 | $188,273 | $198,413 |
| 2022 | $5,194 | $379,105 | $184,582 | $194,523 |
| 2021 | $5,053 | $371,672 | $180,963 | $190,709 |
| 2019 | $4,923 | $360,650 | $175,597 | $185,053 |
| 2018 | $4,758 | $353,579 | $172,154 | $181,425 |
| 2017 | $4,658 | $346,647 | $168,779 | $177,868 |
| 2016 | $4,557 | $339,851 | $165,470 | $174,381 |
| 2015 | $4,446 | $334,747 | $162,985 | $171,762 |
| 2014 | $4,381 | $328,191 | $159,793 | $168,398 |
Source: Public Records
Map
Nearby Homes
- 2408 Westcliffe Ln
- 490 N Civic Dr Unit 101
- 460 N Civic Dr Unit 106
- 440 N Civic Dr Unit 203
- 440 N Civic Dr Unit 105
- 440 N Civic Dr Unit 315
- 460 N Civic Dr Unit 317
- 450 N Civic Dr Unit 311
- 430 N Civic Dr Unit 411
- 470 N Civic Dr Unit 208
- 470 N Civic Dr Unit 105
- 470 N Civic Dr Unit 312
- 470 N Civic Dr Unit 204
- 1308 Walden Rd Unit 32
- 1308 Walden Rd Unit 37
- 1310 Walden Rd Unit 15
- 1310 Walden Rd Unit 11
- 310 N Civic Dr Unit 202
- 320 N Civic Dr Unit 310
- 300 N Civic Dr Unit 303
- 343 Westcliffe Cir
- 345 Westcliffe Cir
- 339 Westcliffe Cir
- 307 Westcliffe Cir
- 347 Westcliffe Cir
- 337 Westcliffe Cir
- 305 Westcliffe Cir
- 349 Westcliffe Cir
- 311 Westcliffe Cir
- 335 Westcliffe Cir
- 2376 Westcliffe Ln
- 313 Westcliffe Cir
- 2378 Westcliffe Ln
- 303 Westcliffe Cir
- 2372 Westcliffe Ln
- 2374 Westcliffe Ln
- 353 Westcliffe Cir
- 315 Westcliffe Cir
- 2380 Westcliffe Ln
- 317 Westcliffe Cir