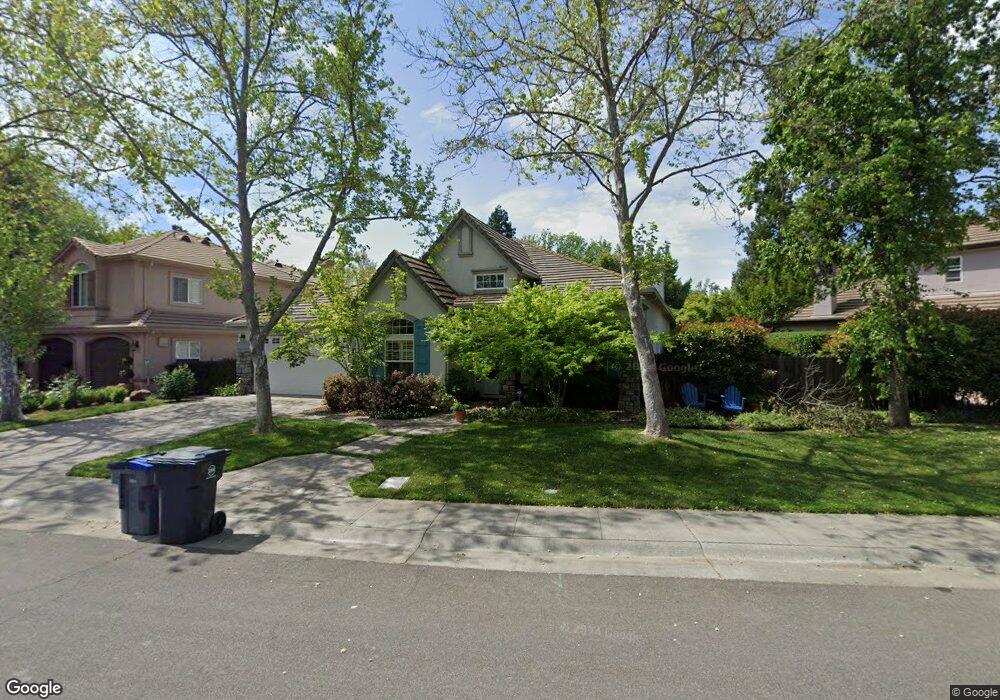
3411 La Playa Dr Davis, CA 95618
East Davis NeighborhoodEstimated Value: $1,019,000 - $1,386,000
4
Beds
3
Baths
2,937
Sq Ft
$404/Sq Ft
Est. Value
About This Home
This home is located at 3411 La Playa Dr, Davis, CA 95618 and is currently estimated at $1,187,719, approximately $404 per square foot. 3411 La Playa Dr is a home located in Yolo County with nearby schools including Fred T. Korematsu Elementary School At Mace Ranch, Frances Ellen Watkins Harper Junior High School, and Davis Senior High School.
Ownership History
Date
Name
Owned For
Owner Type
Purchase Details
Closed on
Oct 18, 2024
Sold by
Alongi John M
Bought by
Alongi Larsen Trust and Alongi
Current Estimated Value
Purchase Details
Closed on
Dec 19, 2017
Sold by
Alongi John M and The Alongi Trust
Bought by
Alongi John M
Purchase Details
Closed on
Sep 22, 2006
Sold by
Alongi Charlie and Charlie & Eunice Alongi Trust
Bought by
Alongi Charlie and Alongi Charlie
Purchase Details
Closed on
Jun 29, 1999
Sold by
Fouts Landscape Inc
Bought by
Alongi Charlie and Alongi Eunice
Purchase Details
Closed on
Oct 14, 1998
Sold by
Oates Marvin L and Lloyd & Nancy Arnold Ltd Partn
Bought by
Fouts Landscape Inc
Home Financials for this Owner
Home Financials are based on the most recent Mortgage that was taken out on this home.
Original Mortgage
$255,451
Interest Rate
6.79%
Mortgage Type
Construction
Create a Home Valuation Report for This Property
The Home Valuation Report is an in-depth analysis detailing your home's value as well as a comparison with similar homes in the area
Home Values in the Area
Average Home Value in this Area
Purchase History
| Date | Buyer | Sale Price | Title Company |
|---|---|---|---|
| Alongi Larsen Trust | -- | None Listed On Document | |
| Alongi John M | -- | None Available | |
| Alongi Charlie | -- | None Available | |
| Alongi Charlie | $430,000 | Placer Title Company | |
| Fouts Landscape Inc | $125,000 | Placer Title Company |
Source: Public Records
Mortgage History
| Date | Status | Borrower | Loan Amount |
|---|---|---|---|
| Previous Owner | Fouts Landscape Inc | $255,451 | |
| Closed | Fouts Landscape Inc | $93,750 |
Source: Public Records
Tax History
| Year | Tax Paid | Tax Assessment Tax Assessment Total Assessment is a certain percentage of the fair market value that is determined by local assessors to be the total taxable value of land and additions on the property. | Land | Improvement |
|---|---|---|---|---|
| 2025 | $10,220 | $677,173 | $195,954 | $481,219 |
| 2023 | $10,220 | $650,880 | $188,346 | $462,534 |
| 2022 | $9,924 | $638,118 | $184,653 | $453,465 |
| 2021 | $9,754 | $625,607 | $181,033 | $444,574 |
| 2020 | $9,623 | $619,193 | $179,177 | $440,016 |
| 2019 | $9,301 | $607,053 | $175,664 | $431,389 |
| 2018 | $8,764 | $595,151 | $172,220 | $422,931 |
| 2017 | $8,441 | $583,483 | $168,844 | $414,639 |
| 2016 | $7,761 | $572,043 | $165,534 | $406,509 |
| 2015 | $7,506 | $563,451 | $163,048 | $400,403 |
| 2014 | $7,506 | $552,415 | $159,855 | $392,560 |
Source: Public Records
Map
Nearby Homes
- 1421 Vigo Ct
- 2807 Layton Dr
- 1120 Colina Ct
- 3224 Via Verde Terrace
- 4410 Frontera Dr
- 1619 Monarch Ln
- 1540 Pastal Way
- 2385 Roualt St
- 1107 Baylor Terrace
- 1108 Baylor Terrace
- 1013 Vanderbilt Terrace
- 1007 Vanderbilt Terrace
- 217 La Vida Way
- 1001 Vanderbilt Terrace
- 1049 Ginkgo Cir
- 1013 Ginkgo Cir
- 1007 Ginkgo Cir
- 1001 Ginkgo Cir
- 2309 O'Keeffe Place
- 257 Quarter Cir
- 3423 La Playa Dr
- 3405 La Playa Dr
- 3242 Conquistador Way
- 3431 La Playa Dr
- 1502 Chalupa Place
- 3418 La Playa Dr
- 1501 Chalupa Place
- 3236 Conquistador Way
- 3437 La Playa Dr
- 3426 La Playa Dr
- 3255 Conquistador Way
- 3249 Conquistador Way Unit 6
- 549 Conquistador Way
- 556 Conquistador Way
- 557 Conquistador Way
- 559 Conquistador Way
- 558 Conquistador Way
- 560 Conquistador Way
- 3243 Conquistador Way
- 3430 La Playa Dr
Your Personal Tour Guide
Ask me questions while you tour the home.