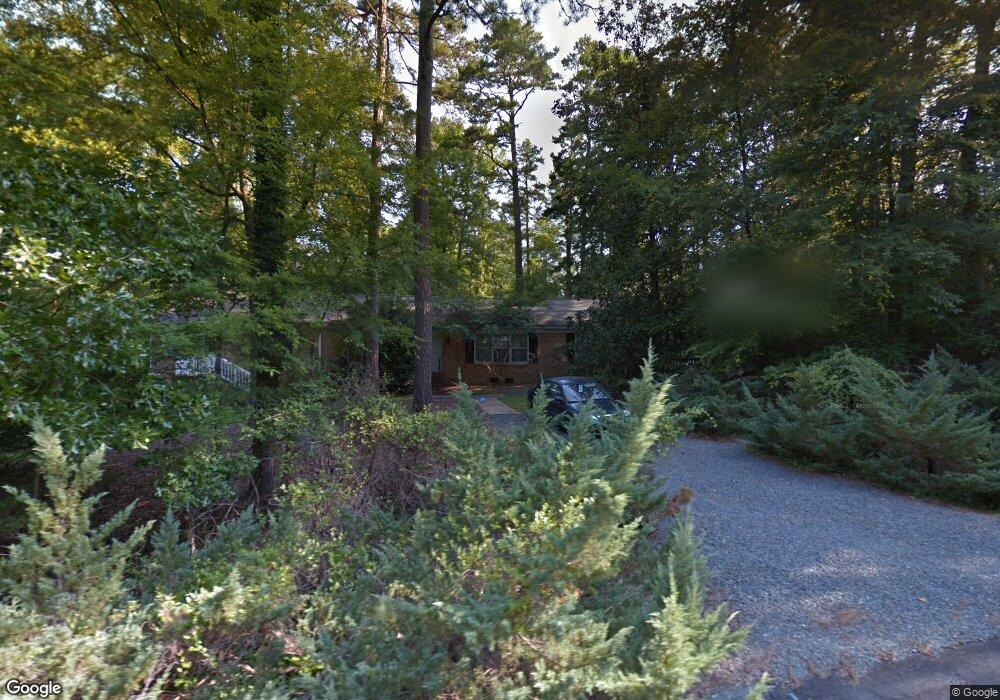
3412 Ogburn Ct Durham, NC 27705
Garrett NeighborhoodEstimated Value: $639,000 - $786,000
4
Beds
3
Baths
2,800
Sq Ft
$249/Sq Ft
Est. Value
About This Home
This home is located at 3412 Ogburn Ct, Durham, NC 27705 and is currently estimated at $697,236, approximately $249 per square foot. 3412 Ogburn Ct is a home located in Durham County with nearby schools including Morehead Montessori, Forest View Elementary, and Sherwood Githens Middle.
Ownership History
Date
Name
Owned For
Owner Type
Purchase Details
Closed on
Jul 5, 2018
Sold by
Kenburn Investments Llc
Bought by
Rotar Ryan J and Rotar Anna K
Current Estimated Value
Home Financials for this Owner
Home Financials are based on the most recent Mortgage that was taken out on this home.
Original Mortgage
$382,500
Outstanding Balance
$327,640
Interest Rate
3.99%
Mortgage Type
Adjustable Rate Mortgage/ARM
Estimated Equity
$369,596
Purchase Details
Closed on
Nov 10, 2017
Sold by
Mudimbe Valentin Yves and Mudimbe Daniel T
Bought by
Kenburn Investments Llc
Home Financials for this Owner
Home Financials are based on the most recent Mortgage that was taken out on this home.
Original Mortgage
$250,000
Interest Rate
3.85%
Mortgage Type
Purchase Money Mortgage
Purchase Details
Closed on
Mar 23, 2001
Sold by
Williams James F and Williams Mary Cunningham
Bought by
Mudimbe Valentin Yves
Home Financials for this Owner
Home Financials are based on the most recent Mortgage that was taken out on this home.
Original Mortgage
$180,500
Interest Rate
6.5%
Create a Home Valuation Report for This Property
The Home Valuation Report is an in-depth analysis detailing your home's value as well as a comparison with similar homes in the area
Home Values in the Area
Average Home Value in this Area
Purchase History
| Date | Buyer | Sale Price | Title Company |
|---|---|---|---|
| Rotar Ryan J | $425,000 | None Available | |
| Kenburn Investments Llc | $145,000 | None Available | |
| Mudimbe Valentin Yves | $190,000 | -- |
Source: Public Records
Mortgage History
| Date | Status | Borrower | Loan Amount |
|---|---|---|---|
| Open | Rotar Ryan J | $382,500 | |
| Previous Owner | Kenburn Investments Llc | $250,000 | |
| Previous Owner | Mudimbe Valentin Yves | $180,500 |
Source: Public Records
Tax History Compared to Growth
Tax History
| Year | Tax Paid | Tax Assessment Tax Assessment Total Assessment is a certain percentage of the fair market value that is determined by local assessors to be the total taxable value of land and additions on the property. | Land | Improvement |
|---|---|---|---|---|
| 2025 | $4,504 | $454,328 | $147,349 | $306,979 |
| 2024 | $5,258 | $376,972 | $58,800 | $318,172 |
| 2023 | $4,938 | $376,972 | $58,800 | $318,172 |
| 2022 | $4,825 | $376,972 | $58,800 | $318,172 |
| 2021 | $4,802 | $376,972 | $58,800 | $318,172 |
| 2020 | $4,689 | $376,972 | $58,800 | $318,172 |
| 2019 | $4,689 | $376,972 | $58,800 | $318,172 |
| 2018 | $3,536 | $260,679 | $58,800 | $201,879 |
| 2017 | $3,510 | $260,679 | $58,800 | $201,879 |
| 2016 | $3,392 | $260,679 | $58,800 | $201,879 |
| 2015 | $3,776 | $272,752 | $44,829 | $227,923 |
| 2014 | $3,776 | $272,752 | $44,829 | $227,923 |
Source: Public Records
Map
Nearby Homes
- 3418 Angus Rd
- 3435 Cromwell Rd
- 3520 Ridge Rd
- 308 Few Cir
- 3116 Coachmans Way
- 3417 Cottonwood Dr
- 3614 Kilgo Dr
- 3088 Colony Rd Unit A
- 3213 Coachmans Way
- 58 Stoneridge Rd
- 11 Gatesway Ct
- 14 Whitburn Place
- 73 Stoneridge Rd
- 3205 W Cornwallis Rd
- 3207 W Cornwallis Rd
- 3018 Annandale Rd
- 3806 Lochnora Pkwy
- 16 Marchmont Ct
- 4011 Garrett Rd
- 16 Pinnacle Rd
- 3406 Ogburn Ct
- 3411 Angus Rd
- 3417 Angus Rd
- 3416 Ogburn Ct
- 3409 Ogburn Ct
- 3407 Angus Rd
- 3415 Ogburn Ct
- 3421 Angus Rd
- 3402 Ogburn Ct
- 3403 Ogburn Ct
- 3417 Ogburn Ct
- 3424 Cromwell Rd
- 3425 Angus Rd
- 3414 Pinafore Dr
- 3408 Pinafore Dr
- 3400 Pinafore Dr
- 3400 Pinafore Dr
- 3420 Pinafore Dr
- 3400R Pinafore Dr
- 3408 Angus Rd