34140 Selva Rd Unit 219 Dana Point, CA 92629
Monarch Beach NeighborhoodEstimated Value: $738,243 - $1,170,000
About This Home
BEACH CLOSE IN DANA POINT, $2650/MO
1 Bedroom, 1 Bath 701 sq ft unfurnished Condo in Dana Point. Walk across street to Strands Beach. Close to Lantern District shops and restaurants and Harbor.
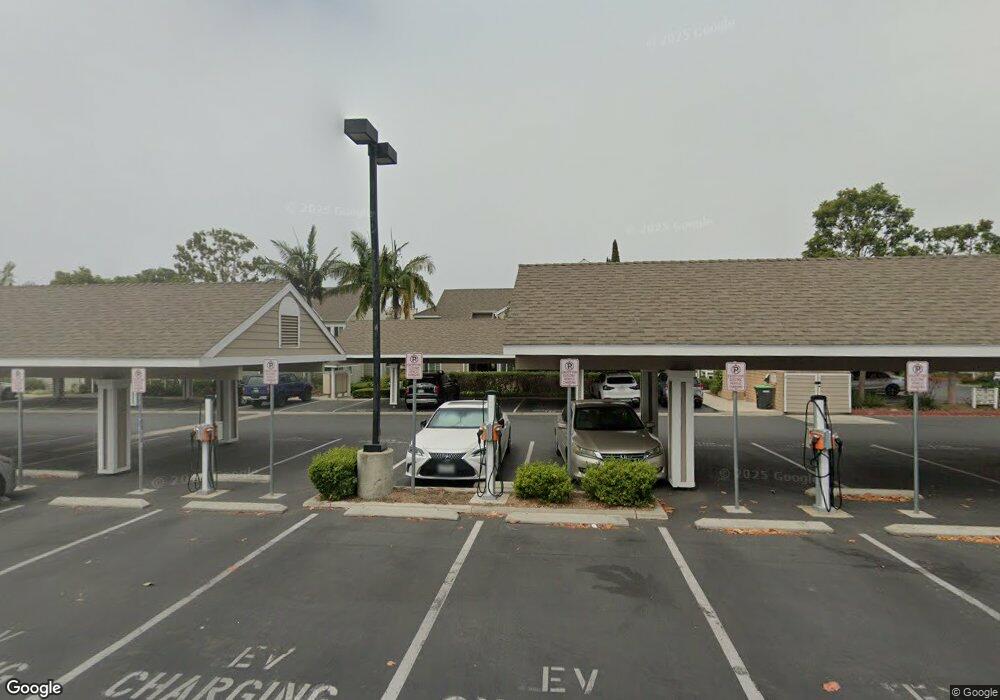
Feel the coastal luxury and fantastic ocean breezes in this seaside community in Dana Point. In the highly desirable community of Niguel Beach Terrace. Enjoy great light throughout the day and indoor/outdoor living with the deck accessible from both the living spaces and the bedroom. Hookups for your washer/dryer. Upstairs unit has vaulted cathedral ceilings that make the living areas feel spacious. Multiple windows bring in an abundance of natural light. There is an assigned parking spot with ample nearby guest parking. Niguel Beach Terrace has an option for electric vehicle charging. With mature grounds, and an inviting pool and spa and clubhouse complex, this community is a great destination location across the street from the beach.
Tenant pays electric, Cable, Internet. No smoking.
Ownership History
Purchase Details
Home Values in the Area
Average Home Value in this Area
Purchase History
| Date | Buyer | Sale Price | Title Company |
|---|---|---|---|
| Charlene Dudman Trust | -- | -- |
Property History
| Date | Event | Price | List to Sale | Price per Sq Ft |
|---|---|---|---|---|
| 10/22/2024 10/22/24 | Off Market | $2,650 | -- | -- |
| 09/19/2024 09/19/24 | For Rent | $2,650 | -- | -- |
Tax History
| Year | Tax Paid | Tax Assessment Tax Assessment Total Assessment is a certain percentage of the fair market value that is determined by local assessors to be the total taxable value of land and additions on the property. | Land | Improvement |
|---|---|---|---|---|
| 2025 | $2,063 | $149,145 | $61,141 | $88,004 |
| 2024 | $2,063 | $146,221 | $59,942 | $86,279 |
| 2023 | $1,971 | $143,354 | $58,766 | $84,588 |
| 2022 | $1,889 | $140,544 | $57,614 | $82,930 |
| 2021 | $1,834 | $137,789 | $56,485 | $81,304 |
| 2020 | $1,849 | $136,377 | $55,906 | $80,471 |
| 2019 | $1,809 | $133,703 | $54,809 | $78,894 |
| 2018 | $1,758 | $131,082 | $53,734 | $77,348 |
| 2017 | $1,704 | $128,512 | $52,680 | $75,832 |
| 2016 | $1,654 | $125,993 | $51,647 | $74,346 |
| 2015 | $1,512 | $124,101 | $50,871 | $73,230 |
| 2014 | $1,488 | $121,671 | $49,875 | $71,796 |
Map
- 34146 Selva Rd Unit 198
- 34028 Selva Rd Unit 77
- 43 Beach View Ave
- 34128 Selva Rd Unit 267
- 34032 Selva Rd Unit 96
- 34134 Selva Rd Unit 248
- 27 Palm Beach Ct
- 33881 Cape Cove
- 11 Beach View Ave
- 23711 Brisbane Bay
- 75 Palm Beach Ct
- 87 Palm Beach Ct
- 17 Pacific Ridge Place
- 24232 Porto Nuovo
- 23502 Seaward Isle
- 23731 Colima Bay
- 34412 St of the Green Lant
- 33902 Valencia Place
- 24372 Vista Point Ln
- 24345 Vista Point Ln
- 34140 Selva Rd
- 34140 Selva Rd
- 34140 Selva Rd Unit 220
- 34140 Selva Rd Unit 222
- 34140 Selva Rd Unit 218
- 34140 Selva Rd Unit 223
- 34140 Selva Rd Unit 217
- 34140 Selva Rd Unit 221
- 34140 Selva Rd Unit 224
- 34138 Selva Rd Unit 226
- 34138 Selva Rd Unit 225
- 34138 Selva Rd Unit 231
- 34138 Selva Rd Unit 232
- 34138 Selva Rd Unit 229
- 34138 Selva Rd Unit 228
- 34138 Selva Rd Unit 227
- 34138 Selva Rd Unit 230
- 34142 Selva Rd Unit 209
- 34142 Selva Rd Unit 214
- 34142 Selva Rd Unit 215
Ask me questions while you tour the home.