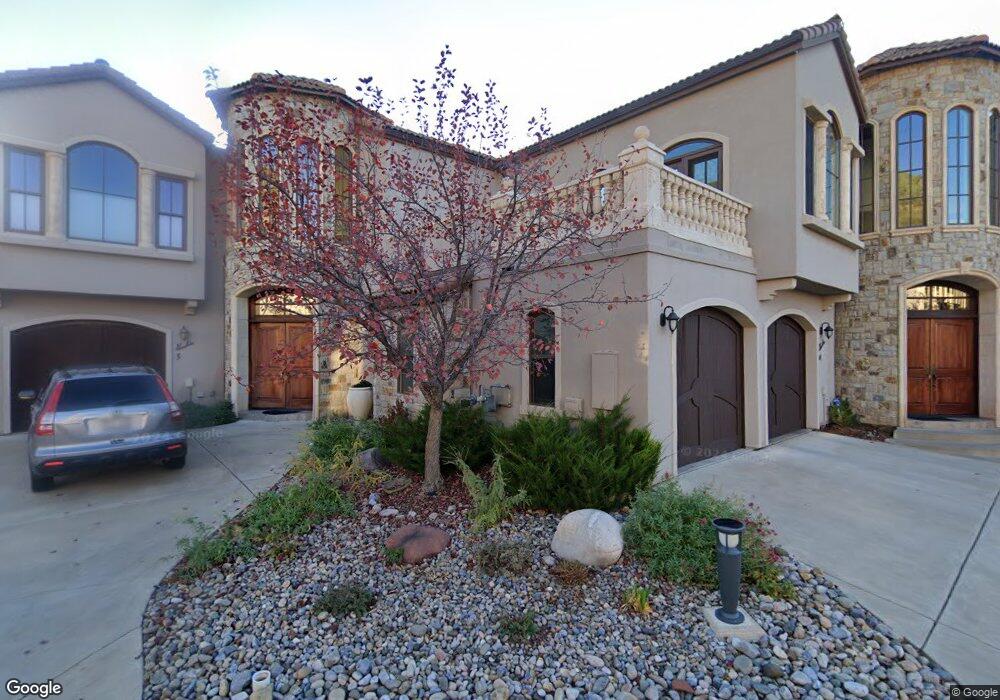
3416 Main Ave Unit C5 Durango, CO 81301
Estimated Value: $905,023 - $985,000
3
Beds
3
Baths
2,195
Sq Ft
$426/Sq Ft
Est. Value
About This Home
This home is located at 3416 Main Ave Unit C5, Durango, CO 81301 and is currently estimated at $935,506, approximately $426 per square foot. 3416 Main Ave Unit C5 is a home located in La Plata County with nearby schools including Riverview Elementary School, Miller Middle School, and Durango High School.
Ownership History
Date
Name
Owned For
Owner Type
Purchase Details
Closed on
May 30, 2025
Sold by
Carlson Gregory Aaron and Carlson Leticia Machado
Bought by
Morgan Mark
Current Estimated Value
Home Financials for this Owner
Home Financials are based on the most recent Mortgage that was taken out on this home.
Original Mortgage
$575,000
Outstanding Balance
$573,530
Interest Rate
6.83%
Mortgage Type
New Conventional
Estimated Equity
$361,976
Purchase Details
Closed on
May 26, 2017
Sold by
Douesnard Richard and Douesnard Victoria
Bought by
Carlson Gregory Aaron and Carlson Leticia Machado
Purchase Details
Closed on
Oct 17, 2011
Sold by
Hunnahs Llc
Bought by
Douesnard Richard and Douesnard Victoria
Home Financials for this Owner
Home Financials are based on the most recent Mortgage that was taken out on this home.
Original Mortgage
$505,000
Interest Rate
4.28%
Mortgage Type
Future Advance Clause Open End Mortgage
Create a Home Valuation Report for This Property
The Home Valuation Report is an in-depth analysis detailing your home's value as well as a comparison with similar homes in the area
Purchase History
| Date | Buyer | Sale Price | Title Company |
|---|---|---|---|
| Morgan Mark | $895,000 | Land Title Guarantee | |
| Carlson Gregory Aaron | $485,000 | Land Title | |
| Douesnard Richard | $505,000 | Land Title Guarantee Company |
Source: Public Records
Mortgage History
| Date | Status | Borrower | Loan Amount |
|---|---|---|---|
| Open | Morgan Mark | $575,000 | |
| Previous Owner | Douesnard Richard | $505,000 |
Source: Public Records
Tax History
| Year | Tax Paid | Tax Assessment Tax Assessment Total Assessment is a certain percentage of the fair market value that is determined by local assessors to be the total taxable value of land and additions on the property. | Land | Improvement |
|---|---|---|---|---|
| 2025 | $2,126 | $56,110 | $13,310 | $42,800 |
| 2024 | $1,809 | $45,000 | $10,600 | $34,400 |
| 2023 | $1,809 | $48,140 | $11,340 | $36,800 |
| 2022 | $1,803 | $50,510 | $11,900 | $38,610 |
| 2021 | $1,811 | $45,620 | $9,850 | $35,770 |
| 2020 | $1,591 | $41,370 | $9,520 | $31,850 |
| 2019 | $1,521 | $41,370 | $9,520 | $31,850 |
| 2018 | $1,446 | $39,800 | $9,020 | $30,780 |
| 2017 | $1,414 | $39,800 | $9,020 | $30,780 |
| 2016 | $1,524 | $46,760 | $9,500 | $37,260 |
| 2015 | $1,281 | $46,760 | $9,500 | $37,260 |
| 2014 | $1,281 | $40,310 | $9,190 | $31,120 |
| 2013 | -- | $40,310 | $9,190 | $31,120 |
Source: Public Records
Map
Nearby Homes
- 3416 Main Ave Unit C2
- 3575 Main Ave
- 3211 W 2 Nd Ave
- 90 Animas View Dr Unit 5
- 35 Sunshine Ct Unit 1
- 35 Sunshine Ct Unit 3
- 35 Sunshine Ct Unit 6
- 3015 Hillside Ave
- 288 Animas View Dr Unit 9
- 288 Animas View Dr Unit 11
- 288 Animas View Dr Unit 121
- 2718 New Mexico Ave Unit D
- 580 Animas View Dr Unit 1
- 900 Florida Rd
- 601 Animas View Dr Unit 204A
- 1200 Florida Rd Unit 7
- 18 Miller Dr
- 1110 Animas View Dr
- 362 W 23rd St
- 2400 Arroyo Dr Unit 22
- 3416 Main Ave Unit 202
- 3416 Main Ave Unit 204
- 3416 Main Ave Unit 104
- 3416 Main Ave Unit B5
- 3416 Main Ave Unit B4
- 3416 Main Ave Unit B3
- 3416 Main Ave Unit B2
- 3416 Main Ave Unit B1
- 3416 Main Ave Unit A3
- 3416 Main Ave Unit A2
- 3416 Main Ave Unit A1
- 3416 Main Ave Unit C4
- 3416 Main Ave Unit C3
- 3416 Main Ave Unit C2
- 3416 Main Ave Unit C1
- 3416 Main Ave Unit La Campanella Commer
- 3416 Main Ave Unit Suite 101
- 3416 Main Ave Unit 203
- 3416 Main Ave Unit Amalfi 1
- 3416 Main Ave
Your Personal Tour Guide
Ask me questions while you tour the home.