NOT LISTED FOR SALE

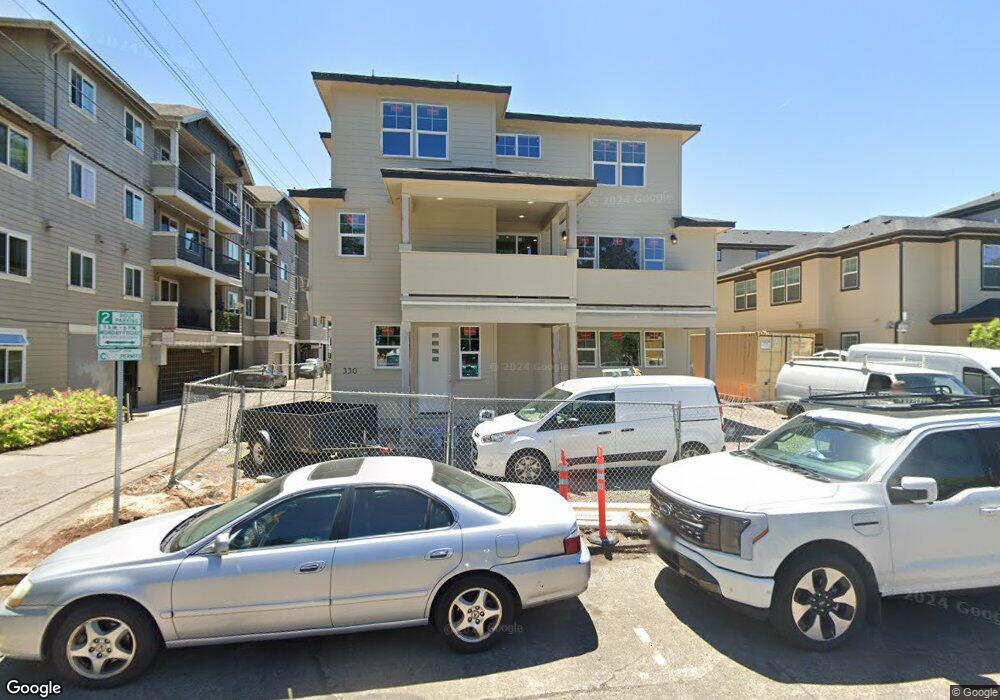
342 E 12th Ave Eugene, OR 97401

Estimated Value: $653,000

6 Beds
2 Baths
3,240 Sq Ft
$202/Sq Ft Est. Value

About This Home

This home is located at 342 E 12th Ave, Eugene, OR 97401 and is currently estimated at $653,000, approximately $201 per square foot. 342 E 12th Ave is a home located in Lane County with nearby schools including Edison Elementary School, Roosevelt Middle School, and South Eugene High School.

Ownership History

Date Name Owned For Owner Type

Purchase Details

Closed on
Aug 15, 2024
Sold by
Our 12Th & High Apartments Llc
Bought by
High St Townhomes Llc
Current Estimated Value
$653,000

Purchase Details

Closed on
Aug 16, 2018
Sold by
Our Property Hodings Two Llc
Bought by
Our 12Th & High Apartments Llc

Purchase Details

Closed on
Mar 4, 2016
Sold by
Corey David S
Bought by
Our Property Holdings Two Llc

Home Financials for this Owner

Home Financials are based on the most recent Mortgage that was taken out on this home.
Original Mortgage
$412,500
Interest Rate
3.93%
Mortgage Type
Commercial

Purchase Details

Closed on
Feb 1, 2016
Sold by
Gildea Larry O and Mechling Wendy S
Bought by
Corey David S

Home Financials for this Owner

Home Financials are based on the most recent Mortgage that was taken out on this home.
Original Mortgage
$412,500
Interest Rate
3.93%
Mortgage Type
Commercial

Range of Values:

Collateral Analytics

Collateral Analytics Collateral Analytics AVMs (Automated Valuation Model) employ a number of statistical approaches combined with neighborhood-specific comparable selection guarantees the most up-to-date and precise valuations.

Not Available

Collateral Analytics does not have data for the current month. Please view the chart for historical values.

ICE

ICE Mortgage Technology ICE Mortgage Technology’s AVM (Automated Valuation Model) is a state-of-the-art online residential property valuation tool that provides a quick and accurate estimate of the value of almost any home in the U.S.

Not Available

ICE Mortgage Technology does not have data for the current month. Please view the chart for historical values.

First American

First American First American Data & Analytics’ next-generation AVM combines unrivaled data assets with a blended ensemble of valuation models to produce highly accurate, reliable valuations you can trust.

Not Available

First American does not have data for the current month. Please view the chart for historical values.

Quantarium

Quantarium Quantarium’s valuation service, repeatedly proven the industry’s most accurate and comprehensive, is supercharged with a self-learning and auto-tuning AI engine that continually becomes smarter and more accurate as it processes daily inputs from the industry’s leading RE data lake.

Not Available

Quantarium does not have data for the current month. Please view the chart for historical values.

Average Value
Not Available
List Price
Sold Price
Create a Home Valuation Report for This Property
The Home Valuation Report is an in-depth analysis detailing your home's value as well as a comparison with similar homes in the area

Home Values in the Area

Source: Public Records

Average Home Value in this Area


Source: Public Records

Purchase History

Date Buyer Sale Price Title Company
High St Townhomes Llc -- Cascade Title
Our 12Th & High Apartments Llc -- Cascade Title Co
Our Property Holdings Two Llc -- Accommodation
Corey David S $550,000 Western Title & Escrow Co
Source: Public Records

Mortgage History

Date Status Borrower Loan Amount
Previous Owner Our 12Th & High Apartments Llc $2,835,000
Previous Owner High St Townhomes Llc $1,250,000
Previous Owner Corey David S $412,500
Previous Owner Gildea Larry O $200,000
Source: Public Records

Tax History Compared to Growth

Source: Public Records

Tax History

Year Tax Paid Tax Assessment Tax Assessment Total Assessment is a certain percentage of the fair market value that is determined by local assessors to be the total taxable value of land and additions on the property. Land Improvement
2023 $10,415 $384,121 $384,121 $0
2022 $5,290 $297,939 $297,939 $0
2021 $7,174 $376,469 $0 $0
2020 $7,128 $365,504 $0 $0
2019 $6,814 $354,859 $0 $0
2018 $6,478 $334,489 $0 $0
2017 $5,984 $334,489 $0 $0
2016 $6,096 $324,747 $0 $0
2015 $5,921 $315,288 $0 $0
2014 $5,802 $306,105 $0 $0
Source: Public Records

Map