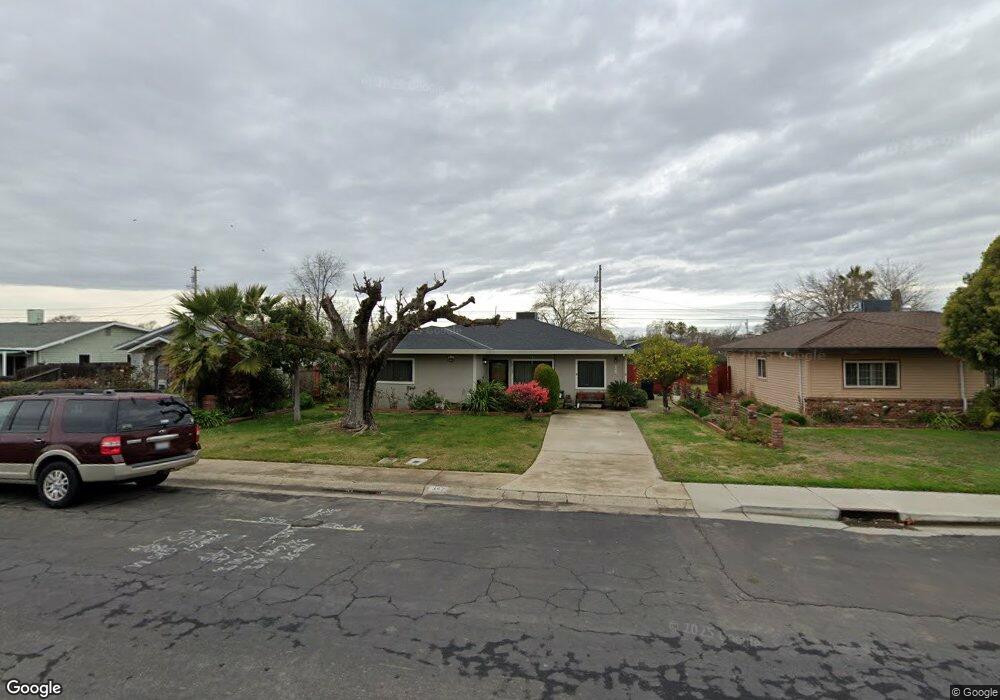
342 H St Lincoln, CA 95648
Estimated Value: $380,000 - $474,000
3
Beds
2
Baths
1,070
Sq Ft
$398/Sq Ft
Est. Value
About This Home
This home is located at 342 H St, Lincoln, CA 95648 and is currently estimated at $425,379, approximately $397 per square foot. 342 H St is a home located in Placer County with nearby schools including First Street, Glen Edwards Middle, and Lincoln High.
Ownership History
Date
Name
Owned For
Owner Type
Purchase Details
Closed on
Mar 12, 2020
Sold by
Lucas Dena
Bought by
Lucas Dena
Current Estimated Value
Purchase Details
Closed on
Aug 17, 2015
Sold by
Lucas Dena
Bought by
Lucas Dena
Home Financials for this Owner
Home Financials are based on the most recent Mortgage that was taken out on this home.
Original Mortgage
$150,000
Interest Rate
3.97%
Mortgage Type
New Conventional
Purchase Details
Closed on
Oct 5, 2000
Sold by
Sousa Antonio G and Sousa Zulmira L
Bought by
Sousa Antonio G and Sousa Zulmira L
Create a Home Valuation Report for This Property
The Home Valuation Report is an in-depth analysis detailing your home's value as well as a comparison with similar homes in the area
Home Values in the Area
Average Home Value in this Area
Purchase History
| Date | Buyer | Sale Price | Title Company |
|---|---|---|---|
| Lucas Dena | -- | None Available | |
| Lucas Dena | -- | Stewart Title | |
| Sousa Antonio G | -- | -- |
Source: Public Records
Mortgage History
| Date | Status | Borrower | Loan Amount |
|---|---|---|---|
| Closed | Lucas Dena | $150,000 |
Source: Public Records
Tax History
| Year | Tax Paid | Tax Assessment Tax Assessment Total Assessment is a certain percentage of the fair market value that is determined by local assessors to be the total taxable value of land and additions on the property. | Land | Improvement |
|---|---|---|---|---|
| 2025 | $1,958 | $193,847 | $54,943 | $138,904 |
| 2023 | $1,958 | $186,321 | $52,810 | $133,511 |
| 2022 | $1,900 | $182,669 | $51,775 | $130,894 |
| 2021 | $1,861 | $179,088 | $50,760 | $128,328 |
| 2020 | $1,850 | $177,253 | $50,240 | $127,013 |
| 2019 | $960 | $94,571 | $49,255 | $45,316 |
| 2018 | $1,009 | $92,718 | $48,290 | $44,428 |
| 2017 | $1,718 | $161,970 | $47,344 | $114,626 |
| 2016 | $1,677 | $158,795 | $46,416 | $112,379 |
| 2015 | $384 | $34,659 | $5,580 | $29,079 |
| 2014 | $374 | $33,981 | $5,471 | $28,510 |
Source: Public Records
Map
Nearby Homes
Your Personal Tour Guide
Ask me questions while you tour the home.