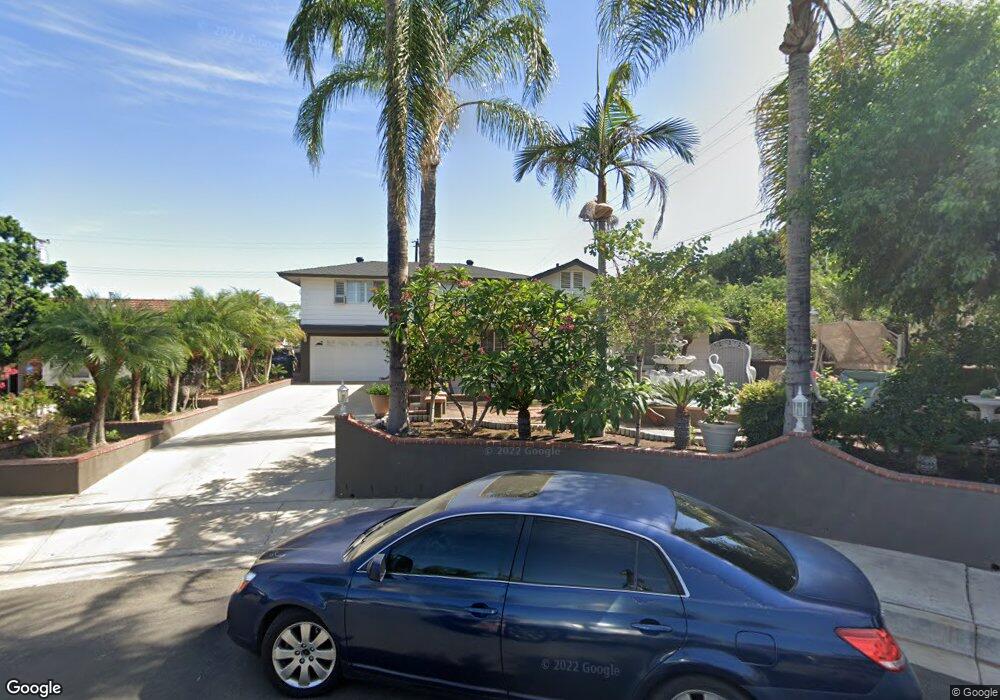
3421 Mapleleaf Dr Riverside, CA 92503
Estimated Value: $606,000 - $738,000
4
Beds
3
Baths
1,470
Sq Ft
$447/Sq Ft
Est. Value
About This Home
This home is located at 3421 Mapleleaf Dr, Riverside, CA 92503 and is currently estimated at $657,262, approximately $447 per square foot. 3421 Mapleleaf Dr is a home located in Riverside County with nearby schools including Phillip M. Stokoe Elementary School, Ysmael Villegas Middle School, and Hillcrest High School.
Ownership History
Date
Name
Owned For
Owner Type
Purchase Details
Closed on
Nov 3, 2021
Sold by
Canchola Jose
Bought by
Canchola Alexander
Current Estimated Value
Home Financials for this Owner
Home Financials are based on the most recent Mortgage that was taken out on this home.
Original Mortgage
$270,750
Outstanding Balance
$247,714
Interest Rate
2.88%
Mortgage Type
New Conventional
Estimated Equity
$409,548
Purchase Details
Closed on
Dec 7, 2005
Sold by
Canchola Ana
Bought by
Canchola Jose
Home Financials for this Owner
Home Financials are based on the most recent Mortgage that was taken out on this home.
Original Mortgage
$340,000
Interest Rate
6.31%
Mortgage Type
Stand Alone Refi Refinance Of Original Loan
Purchase Details
Closed on
Aug 15, 1995
Sold by
Fato Cesare and Fato Veronica
Bought by
Canchola Jose and Canchola Ana
Create a Home Valuation Report for This Property
The Home Valuation Report is an in-depth analysis detailing your home's value as well as a comparison with similar homes in the area
Home Values in the Area
Average Home Value in this Area
Purchase History
| Date | Buyer | Sale Price | Title Company |
|---|---|---|---|
| Canchola Alexander | $285,000 | Fidelity National Title Ie | |
| Canchola Jose | -- | Investors Title Company | |
| Canchola Jose | -- | -- |
Source: Public Records
Mortgage History
| Date | Status | Borrower | Loan Amount |
|---|---|---|---|
| Open | Canchola Alexander | $270,750 | |
| Previous Owner | Canchola Jose | $340,000 |
Source: Public Records
Tax History
| Year | Tax Paid | Tax Assessment Tax Assessment Total Assessment is a certain percentage of the fair market value that is determined by local assessors to be the total taxable value of land and additions on the property. | Land | Improvement |
|---|---|---|---|---|
| 2025 | $6,591 | $546,521 | $74,284 | $472,237 |
| 2023 | $6,591 | $525,300 | $71,400 | $453,900 |
| 2022 | $6,075 | $515,000 | $70,000 | $445,000 |
| 2021 | $2,663 | $222,266 | $61,368 | $160,898 |
| 2020 | $2,620 | $219,988 | $60,739 | $159,249 |
| 2019 | $2,585 | $215,676 | $59,549 | $156,127 |
| 2018 | $2,548 | $211,448 | $58,383 | $153,065 |
| 2017 | $2,500 | $207,303 | $57,239 | $150,064 |
| 2016 | $2,458 | $203,239 | $56,117 | $147,122 |
| 2015 | $2,424 | $200,188 | $55,275 | $144,913 |
| 2014 | $2,415 | $196,269 | $54,194 | $142,075 |
Source: Public Records
Map
Nearby Homes
- 3565 Dixie Ln
- 3447 Yuba Cir
- 12671 Hollyglen Cir
- 12740 Tehama Cir
- 12840 Mayflower Ct
- 3500 Buchanan St Unit 120
- 3500 Buchanan St Unit 24
- 3500 Buchanan St Unit 145
- 3500 Buchanan St Unit 173
- 3500 Buchanan St Unit 103
- 3500 Buchanan St Unit 73
- 3500 Buchanan St Unit 117
- 3500 Buchanan St Unit 107
- 3500 Buchanan St Unit 162
- 3500 Buchanan St Unit 230
- 16286 Lakepointe Dr
- 3700 Buchanan Ave Unit 72
- 3700 Buchanan Ave Unit 25
- 3700 Buchanan St Unit 180
- 3700 Buchanan St Unit 98
- 3431 Mapleleaf Dr
- 3416 Meadowview Dr
- 3441 Mapleleaf Dr
- 3426 Meadowview Dr
- 3395 Graywood Ct
- 3436 Meadowview Dr
- 3420 Mapleleaf Dr
- 3451 Mapleleaf Dr
- 3430 Mapleleaf Dr
- 3391 Graywood Ct
- 3440 Mapleleaf Dr
- 3461 Mapleleaf Dr
- 3387 Graywood Ct
- 12605 Riverwood Way
- 3450 Mapleleaf Dr
- 3456 Meadowview Dr
- 3421 Dixie Ln
- 3415 Meadowview Dr
- 3425 Meadowview Dr
- 3431 Dixie Ln
Your Personal Tour Guide
Ask me questions while you tour the home.