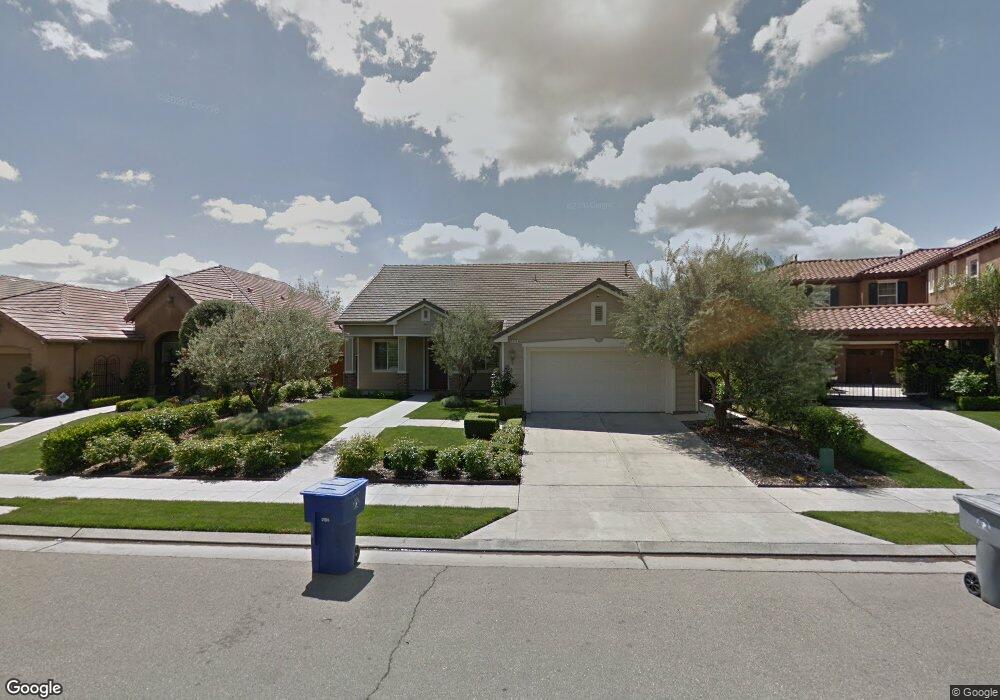
3424 Prescott Ave Clovis, CA 93619
Estimated Value: $542,303 - $666,000
3
Beds
3
Baths
1,995
Sq Ft
$303/Sq Ft
Est. Value
About This Home
This home is located at 3424 Prescott Ave, Clovis, CA 93619 and is currently estimated at $604,101, approximately $302 per square foot. 3424 Prescott Ave is a home located in Fresno County with nearby schools including Bud Rank Elementary School, Granite Ridge Intermediate School, and Clovis North High School.
Ownership History
Date
Name
Owned For
Owner Type
Purchase Details
Closed on
Jan 30, 2007
Sold by
Town & Country At Harlan Ranch Lp
Bought by
Vadlamudi Balaji P and Swarna Jyothsna
Current Estimated Value
Home Financials for this Owner
Home Financials are based on the most recent Mortgage that was taken out on this home.
Original Mortgage
$295,000
Outstanding Balance
$177,183
Interest Rate
6.21%
Mortgage Type
Purchase Money Mortgage
Estimated Equity
$426,918
Purchase Details
Closed on
Jul 31, 2006
Sold by
Cvec Group Inc
Bought by
Town & Country At Harlan Ranch Lp
Home Financials for this Owner
Home Financials are based on the most recent Mortgage that was taken out on this home.
Original Mortgage
$14,130,000
Interest Rate
6.69%
Mortgage Type
Construction
Create a Home Valuation Report for This Property
The Home Valuation Report is an in-depth analysis detailing your home's value as well as a comparison with similar homes in the area
Home Values in the Area
Average Home Value in this Area
Purchase History
| Date | Buyer | Sale Price | Title Company |
|---|---|---|---|
| Vadlamudi Balaji P | $369,000 | Chicago Title Company | |
| Town & Country At Harlan Ranch Lp | -- | Chicago Title Company |
Source: Public Records
Mortgage History
| Date | Status | Borrower | Loan Amount |
|---|---|---|---|
| Open | Vadlamudi Balaji P | $295,000 | |
| Previous Owner | Town & Country At Harlan Ranch Lp | $14,130,000 |
Source: Public Records
Tax History
| Year | Tax Paid | Tax Assessment Tax Assessment Total Assessment is a certain percentage of the fair market value that is determined by local assessors to be the total taxable value of land and additions on the property. | Land | Improvement |
|---|---|---|---|---|
| 2025 | $6,154 | $494,371 | $167,467 | $326,904 |
| 2023 | $5,909 | $475,176 | $160,965 | $314,211 |
| 2022 | $5,824 | $465,859 | $157,809 | $308,050 |
| 2021 | $5,642 | $456,725 | $154,715 | $302,010 |
| 2020 | $5,355 | $430,000 | $160,000 | $270,000 |
| 2019 | $5,131 | $411,400 | $123,300 | $288,100 |
| 2018 | $4,974 | $399,600 | $119,800 | $279,800 |
| 2017 | $4,713 | $377,100 | $113,100 | $264,000 |
| 2016 | $4,435 | $359,300 | $107,800 | $251,500 |
| 2015 | $4,208 | $340,600 | $102,200 | $238,400 |
| 2014 | $3,956 | $319,000 | $95,700 | $223,300 |
Source: Public Records
Map
Nearby Homes
- 3544 Prescott Ave
- 1742 N Broadbent Ln
- 3560 Bloomfield Ln
- 3396 Trenton Ave
- 1609 N Piccadilly Ln
- 1687 N Blackwood Ave
- 3531 Alcove Way
- 1675 N Blackwood Ave
- 3202 Everglade Ave
- 1521 N Encoure Way
- 3664 Vermont Ln
- 3482 Elevations Way
- 3211 Salem Ave
- 1814 N Notting Hill Ln
- 3855 Harlan Ranch Blvd
- 1565 N Kaweah Ave
- 3708 Richmond Ave
- 1719 N Whitmore Ave
- 3088 Teague Ave
- 1347 N Redington Ave
- 3444 Prescott Ave
- 3414 Prescott Ave
- 3454 Prescott Ave
- 1823 N Nadine Ave
- 1812 N Nadine Ave
- 3474 Prescott Ave
- 3431 Bloomfield Ln
- 1822 N Nadine Ave
- 3411 Bloomfield Ln
- 1814 N Pamela Ave
- 1833 N Nadine Ave
- 3441 Bloomfield Ln
- 3484 Prescott Ave
- 3461 Bloomfield Ln
- 1832 N Nadine Ave
- 3471 Bloomfield Ln
- 1824 N Pamela Ave
- 3401 Bloomfield Ln
- 1853 N Nadine Ave
- 3504 Prescott Ave
Your Personal Tour Guide
Ask me questions while you tour the home.