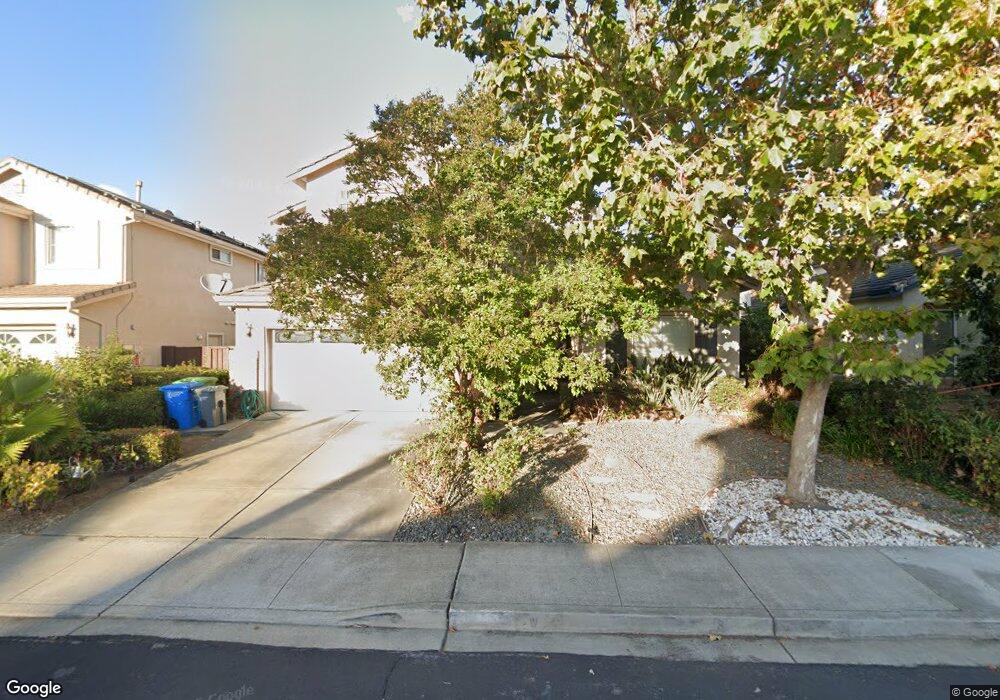
34249 Aspen Loop Union City, CA 94587
Downtown Union City NeighborhoodEstimated Value: $1,490,000 - $1,639,000
5
Beds
3
Baths
2,300
Sq Ft
$671/Sq Ft
Est. Value
About This Home
This home is located at 34249 Aspen Loop, Union City, CA 94587 and is currently estimated at $1,542,467, approximately $670 per square foot. 34249 Aspen Loop is a home located in Alameda County with nearby schools including Guy Jr. Emanuele Elementary School, Cesar Chavez Middle School, and James Logan High School.
Ownership History
Date
Name
Owned For
Owner Type
Purchase Details
Closed on
Aug 2, 2021
Sold by
Zhuang Wen F
Bought by
Zhuang Wen and The Wen Zhuang Uving Trust
Current Estimated Value
Home Financials for this Owner
Home Financials are based on the most recent Mortgage that was taken out on this home.
Original Mortgage
$290,000
Interest Rate
2.2%
Mortgage Type
New Conventional
Purchase Details
Closed on
Jun 16, 2018
Sold by
Zhuang Wen
Bought by
Zhuang Wen and Wen Zhuang Living Trust
Purchase Details
Closed on
Sep 1, 2006
Sold by
Zhuang Wen
Bought by
Zhuang Wen
Home Financials for this Owner
Home Financials are based on the most recent Mortgage that was taken out on this home.
Original Mortgage
$500,000
Interest Rate
2%
Mortgage Type
Negative Amortization
Purchase Details
Closed on
Aug 29, 2003
Sold by
Feng Tsoo
Bought by
Zhung Wen
Purchase Details
Closed on
Jun 15, 1999
Sold by
Scs Development Co
Bought by
Feng Tsoo and Zhuang Wen
Create a Home Valuation Report for This Property
The Home Valuation Report is an in-depth analysis detailing your home's value as well as a comparison with similar homes in the area
Home Values in the Area
Average Home Value in this Area
Purchase History
| Date | Buyer | Sale Price | Title Company |
|---|---|---|---|
| Zhuang Wen | -- | Chicago Title Company | |
| Zhuang Wen F | -- | Chicago Title Company | |
| Zhuang Wen | -- | None Available | |
| Zhuang Wen | -- | Alliance Title Company | |
| Zhung Wen | -- | -- | |
| Feng Tsoo | $385,000 | First American Title Guarant |
Source: Public Records
Mortgage History
| Date | Status | Borrower | Loan Amount |
|---|---|---|---|
| Previous Owner | Zhuang Wen F | $290,000 | |
| Previous Owner | Zhuang Wen | $500,000 |
Source: Public Records
Tax History
| Year | Tax Paid | Tax Assessment Tax Assessment Total Assessment is a certain percentage of the fair market value that is determined by local assessors to be the total taxable value of land and additions on the property. | Land | Improvement |
|---|---|---|---|---|
| 2025 | $9,373 | $596,062 | $181,373 | $421,689 |
| 2024 | $9,373 | $584,241 | $177,818 | $413,423 |
| 2023 | $9,070 | $579,650 | $174,332 | $405,318 |
| 2022 | $8,904 | $561,286 | $170,914 | $397,372 |
| 2021 | $8,707 | $550,144 | $167,563 | $389,581 |
| 2020 | $8,540 | $551,432 | $165,845 | $385,587 |
| 2019 | $8,603 | $540,622 | $162,594 | $378,028 |
| 2018 | $8,404 | $530,023 | $159,406 | $370,617 |
| 2017 | $8,205 | $519,632 | $156,281 | $363,351 |
| 2016 | $7,915 | $509,446 | $153,218 | $356,228 |
| 2015 | $7,764 | $501,794 | $150,916 | $350,878 |
| 2014 | $7,480 | $491,965 | $147,960 | $344,005 |
Source: Public Records
Map
Nearby Homes
- 33941 9th St
- 645 F St
- 33554 7th St
- 33638 9th St
- 33848 10th St
- 33840 10th St
- 33853 10th St
- 110 Pear Ln
- 267 Famoso Plaza
- 33721 12th St
- 235 Famoso Plaza
- 245 Famoso Plaza
- 35185 11th St Unit 274
- 33528 13th St
- 152 Aurora Plaza
- 116 Mahogany Ln
- 352 Monte Carlo Ave
- 165 Aurora Plaza
- 1059 Sapphire Terrace Unit 353
- 351 Riviera Dr
- 34245 Aspen Loop
- 34253 Aspen Loop
- 34241 Aspen Loop
- 34257 Aspen Loop
- 34248 Aspen Loop
- 34252 Aspen Loop
- 34244 Aspen Loop
- 34237 Aspen Loop
- 34261 Aspen Loop
- 34256 Aspen Loop
- 34240 Aspen Loop
- 34260 Aspen Loop
- 34233 Aspen Loop
- 34265 Aspen Loop
- 34236 Aspen Loop
- 34249 Myrtle Ln
- 34253 Myrtle Ln
- 34245 Myrtle Ln
- 34264 Aspen Loop
- 34257 Myrtle Ln
Your Personal Tour Guide
Ask me questions while you tour the home.