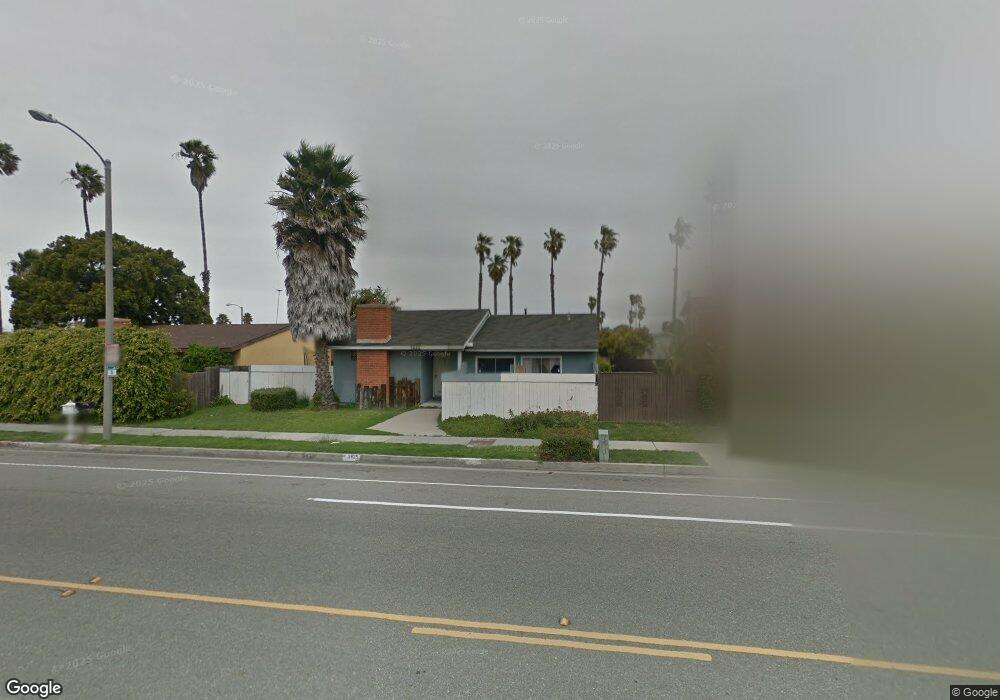
3425 W Hemlock St Oxnard, CA 93035
Via Marina NeighborhoodEstimated Value: $706,700 - $851,000
3
Beds
2
Baths
1,374
Sq Ft
$550/Sq Ft
Est. Value
About This Home
This home is located at 3425 W Hemlock St, Oxnard, CA 93035 and is currently estimated at $756,175, approximately $550 per square foot. 3425 W Hemlock St is a home located in Ventura County with nearby schools including Christa Mcauliffe Elementary School and Oxnard High School.
Ownership History
Date
Name
Owned For
Owner Type
Purchase Details
Closed on
Oct 3, 2024
Sold by
Ruth Duldulao Mcpherson Trust and Soto Juan M
Bought by
801 Novato Llc
Current Estimated Value
Purchase Details
Closed on
Feb 22, 2005
Sold by
Mcpherson Ruth and Mcpherson Ruth D
Bought by
Mcpherson Ruth Duldulao
Purchase Details
Closed on
Oct 30, 1998
Sold by
Gottlieb Gary
Bought by
Mcpherson Ruth
Home Financials for this Owner
Home Financials are based on the most recent Mortgage that was taken out on this home.
Original Mortgage
$135,200
Interest Rate
6.78%
Purchase Details
Closed on
Sep 1, 1998
Sold by
Molitor Don I
Bought by
Gottlieb Gary
Home Financials for this Owner
Home Financials are based on the most recent Mortgage that was taken out on this home.
Original Mortgage
$135,200
Interest Rate
6.78%
Purchase Details
Closed on
Jul 31, 1995
Sold by
Blok Gerrit W and Blok Barbara J
Bought by
Blok Barbara J Bauer
Create a Home Valuation Report for This Property
The Home Valuation Report is an in-depth analysis detailing your home's value as well as a comparison with similar homes in the area
Home Values in the Area
Average Home Value in this Area
Purchase History
| Date | Buyer | Sale Price | Title Company |
|---|---|---|---|
| 801 Novato Llc | -- | None Listed On Document | |
| Mcpherson Ruth Duldulao | -- | Lawyers | |
| Mcpherson Ruth | $169,000 | -- | |
| Gottlieb Gary | $128,485 | Stewart Title | |
| Blok Barbara J Bauer | -- | -- |
Source: Public Records
Mortgage History
| Date | Status | Borrower | Loan Amount |
|---|---|---|---|
| Previous Owner | Mcpherson Ruth | $135,200 |
Source: Public Records
Tax History
| Year | Tax Paid | Tax Assessment Tax Assessment Total Assessment is a certain percentage of the fair market value that is determined by local assessors to be the total taxable value of land and additions on the property. | Land | Improvement |
|---|---|---|---|---|
| 2025 | $7,546 | $622,397 | $404,829 | $217,568 |
| 2024 | $7,546 | $610,194 | $396,892 | $213,302 |
| 2023 | $7,271 | $598,230 | $389,110 | $209,120 |
| 2022 | $7,052 | $586,500 | $381,480 | $205,020 |
| 2021 | $3,004 | $244,737 | $97,892 | $146,845 |
| 2020 | $3,059 | $242,230 | $96,889 | $145,341 |
| 2019 | $2,973 | $237,482 | $94,990 | $142,492 |
| 2018 | $2,932 | $232,827 | $93,128 | $139,699 |
| 2017 | $2,784 | $228,262 | $91,302 | $136,960 |
| 2016 | $2,687 | $223,787 | $89,512 | $134,275 |
| 2015 | $2,715 | $220,427 | $88,168 | $132,259 |
| 2014 | $2,686 | $216,111 | $86,442 | $129,669 |
Source: Public Records
Map
Nearby Homes
- 701 Halyard St
- 2620 Tiller Ave
- 732 W Hemlock St
- 734 W Hemlock St
- 2667 Hurricane Cove
- 2612 Tiller Ave
- 729 Halyard St
- 2616 Tiller Ave
- 2610 Tiller Ave
- 2646 Hurricane Cove
- 3644 Islander Walk
- 3661 Islander Walk
- 2555 Pirate Cove
- 2582 Spinnaker Ave
- 469 Corvette St
- 2554 Spinnaker Ave
- 3729 Islander Walk
- 2615 Yardarm Ave
- 2563 Spinnaker Ave
- 3000 Isle Way Unit C
- 3415 W Hemlock St
- 3441 W Hemlock St
- 3430 Isle Way
- 3401 W Hemlock St
- 3420 Isle Way
- 3440 Isle Way
- 3410 Isle Way
- 634 W Hemlock St
- 628 W Hemlock St Unit 1
- 3351 W Hemlock St
- 618 W Hemlock St
- 632 W Hemlock St Unit 3
- 630 W Hemlock St Unit 3
- 3501 W Hemlock St
- 644 W Hemlock St
- 636 W Hemlock St Unit 2
- 636 W Hemlock St
- 3400 Isle Way
- 620 W Hemlock St
- 624 W Hemlock St Unit 4
Your Personal Tour Guide
Ask me questions while you tour the home.