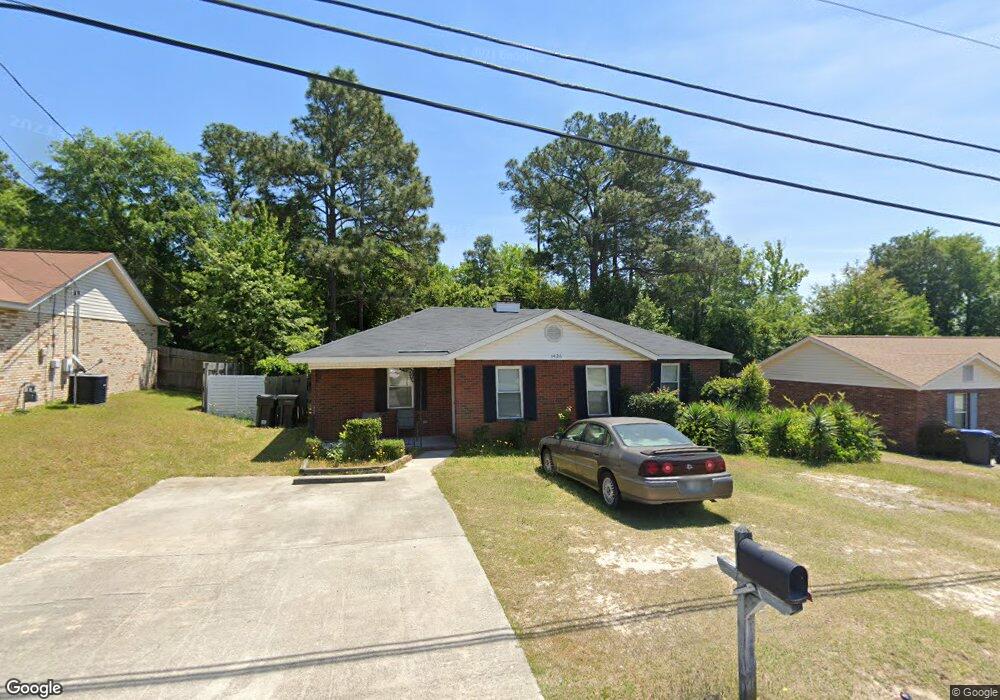
3426 Mcalpine Dr Augusta, GA 30906
Meadowbrook NeighborhoodEstimated Value: $142,000 - $156,000
3
Beds
2
Baths
1,298
Sq Ft
$113/Sq Ft
Est. Value
About This Home
This home is located at 3426 Mcalpine Dr, Augusta, GA 30906 and is currently estimated at $146,797, approximately $113 per square foot. 3426 Mcalpine Dr is a home located in Richmond County with nearby schools including Meadowbrook Elementary School, Glenn Hills Middle School, and Johnson Magnet.
Ownership History
Date
Name
Owned For
Owner Type
Purchase Details
Closed on
Apr 18, 2023
Sold by
Steinberg Stephen H
Bought by
Shs Augusta Iii Llc
Current Estimated Value
Purchase Details
Closed on
Dec 2, 2008
Sold by
Powell Edward E and Wells Fargo Bank Na
Bought by
Steinberg Stephen H and Walker William E
Purchase Details
Closed on
Jan 4, 2000
Sold by
Powell Edward
Bought by
Oxlund Jens R
Purchase Details
Closed on
Oct 13, 1992
Sold by
John C Weaver Home
Bought by
Powell Edward E
Purchase Details
Closed on
Mar 6, 1992
Sold by
Mutimer Blair L Jr Mutimer Lillie B
Bought by
Weaver John C Weaver Shelia T
Purchase Details
Closed on
Feb 26, 1992
Sold by
Mutimer Blair L
Bought by
Weaver John C
Purchase Details
Closed on
Feb 25, 1992
Sold by
Weaver John C
Bought by
John C Weaver Home
Purchase Details
Closed on
Nov 5, 1991
Sold by
Mutimer Lillie B Mutimer Blair L
Bought by
Mutimer Lillie B Mutimer Blair L
Purchase Details
Closed on
Jan 17, 1989
Sold by
Mutimer Catherine G Mutimer George
Bought by
Mutimer Blair L
Create a Home Valuation Report for This Property
The Home Valuation Report is an in-depth analysis detailing your home's value as well as a comparison with similar homes in the area
Home Values in the Area
Average Home Value in this Area
Purchase History
| Date | Buyer | Sale Price | Title Company |
|---|---|---|---|
| Shs Augusta Iii Llc | -- | -- | |
| Steinberg Stephen H | $34,471 | None Available | |
| Steinberg Stephen H | $34,500 | -- | |
| Oxlund Jens R | -- | -- | |
| Powell Edward E | $59,900 | -- | |
| Weaver John C Weaver Shelia T | -- | -- | |
| Weaver John C | $40,000 | -- | |
| John C Weaver Home | $52,500 | -- | |
| Mutimer Lillie B Mutimer Blair L | -- | -- | |
| Mutimer Blair L | -- | -- |
Source: Public Records
Tax History
| Year | Tax Paid | Tax Assessment Tax Assessment Total Assessment is a certain percentage of the fair market value that is determined by local assessors to be the total taxable value of land and additions on the property. | Land | Improvement |
|---|---|---|---|---|
| 2025 | $1,703 | $39,072 | $3,400 | $35,672 |
| 2024 | $1,703 | $42,184 | $3,400 | $38,784 |
| 2023 | $1,661 | $49,124 | $3,400 | $45,724 |
| 2022 | $1,235 | $25,532 | $3,400 | $22,132 |
| 2021 | $1,332 | $26,436 | $3,400 | $23,036 |
| 2020 | $1,317 | $26,436 | $3,400 | $23,036 |
| 2019 | $1,375 | $26,436 | $3,400 | $23,036 |
| 2018 | $1,382 | $26,436 | $3,400 | $23,036 |
| 2017 | $1,313 | $26,436 | $3,400 | $23,036 |
| 2016 | $1,200 | $26,436 | $3,400 | $23,036 |
| 2015 | $1,207 | $26,436 | $3,400 | $23,036 |
| 2014 | $1,203 | $26,276 | $3,400 | $22,876 |
Source: Public Records
Map
Nearby Homes
- 3421 Mcalpine Dr
- 3529 Evangeline Dr
- 2538 Kensington Dr W
- 3415 Cauthen Dr
- 2914 Cumberland Dr
- 2916 Panhandle Cir
- 3427 Chadbourne St
- 2532 Kensington Dr E
- 3602 Audubon Place
- 3602 Kinglet Ct
- 3535 Redd Dr
- 3608 Sturnidae Dr
- 2504 Hastings Dr
- 3324 Blanchard Rd
- 2965 Meadowbrook Dr
- 3614 Rolling Meadows Dr
- 3620 Sturnidae Dr
- 3621 Columbine Dr
- 3526 Spring Glen Ln
- 2713 Antler Dr N
- 3424 Mcalpine Dr
- 3428 Mcalpine Dr
- 3422 Mcalpine Dr
- 3430 Mcalpine Dr
- 3427 Mcalpine Dr
- 3425 Mcalpine Dr
- 3429 Mcalpine Dr
- 3423 Mcalpine Dr
- 3420 Mcalpine Dr
- 3432 Mcalpine Dr
- 3431 Mcalpine Dr
- 3525 Mutimer Dr
- 3418 Mcalpine Dr
- 3434 Mcalpine Dr
- 3433 Mcalpine Dr
- 3432 Kensington Dr
- 3430 Kensington Dr
- 3419 Mcalpine Dr
- 3430 Kensington Dr S
- 3432 Kensington Dr S
Your Personal Tour Guide
Ask me questions while you tour the home.