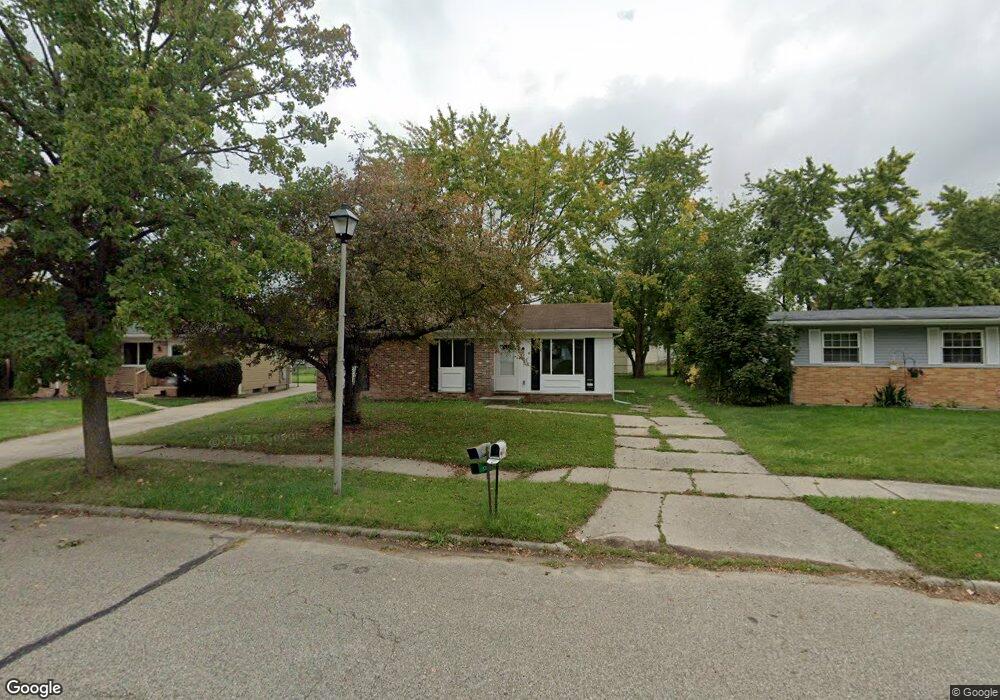
3427 Danbury Crossroad St Lansing, MI 48911
Southern Lansing NeighborhoodEstimated Value: $116,199 - $150,000
--
Bed
1
Bath
1,036
Sq Ft
$131/Sq Ft
Est. Value
About This Home
This home is located at 3427 Danbury Crossroad St, Lansing, MI 48911 and is currently estimated at $135,800, approximately $131 per square foot. 3427 Danbury Crossroad St is a home located in Ingham County with nearby schools including Reo Elementary School, Attwood School, and Everett High School.
Ownership History
Date
Name
Owned For
Owner Type
Purchase Details
Closed on
Feb 13, 2020
Sold by
Wilson Barry and Wilson Kelli Jo
Bought by
Sis Acquistions Group Llc
Current Estimated Value
Purchase Details
Closed on
Dec 19, 2000
Sold by
Sears Michael J and Sears Nancy R
Bought by
Wilson Barry
Home Financials for this Owner
Home Financials are based on the most recent Mortgage that was taken out on this home.
Original Mortgage
$79,895
Interest Rate
7.77%
Mortgage Type
FHA
Purchase Details
Closed on
Jan 29, 1999
Sold by
Nichols Arner L and Bowens Catherine E
Bought by
Sears Michael J and Sears Nancy R
Home Financials for this Owner
Home Financials are based on the most recent Mortgage that was taken out on this home.
Original Mortgage
$25,500
Interest Rate
6.92%
Mortgage Type
Purchase Money Mortgage
Create a Home Valuation Report for This Property
The Home Valuation Report is an in-depth analysis detailing your home's value as well as a comparison with similar homes in the area
Home Values in the Area
Average Home Value in this Area
Purchase History
| Date | Buyer | Sale Price | Title Company |
|---|---|---|---|
| Sis Acquistions Group Llc | $33,751 | None Available | |
| Wilson Barry | $80,950 | Midstate Title Company | |
| Sears Michael J | $33,500 | -- |
Source: Public Records
Mortgage History
| Date | Status | Borrower | Loan Amount |
|---|---|---|---|
| Previous Owner | Wilson Barry | $79,895 | |
| Previous Owner | Sears Michael J | $25,500 |
Source: Public Records
Tax History Compared to Growth
Tax History
| Year | Tax Paid | Tax Assessment Tax Assessment Total Assessment is a certain percentage of the fair market value that is determined by local assessors to be the total taxable value of land and additions on the property. | Land | Improvement |
|---|---|---|---|---|
| 2025 | $2,551 | $61,100 | $9,600 | $51,500 |
| 2024 | $21 | $48,500 | $9,600 | $38,900 |
| 2023 | $2,401 | $41,400 | $9,600 | $31,800 |
| 2022 | $2,193 | $36,000 | $6,900 | $29,100 |
| 2021 | $2,143 | $32,100 | $5,600 | $26,500 |
| 2020 | $1,668 | $29,300 | $5,600 | $23,700 |
| 2019 | $1,597 | $28,200 | $5,600 | $22,600 |
| 2018 | $1,499 | $25,300 | $5,600 | $19,700 |
| 2017 | $1,434 | $25,300 | $5,600 | $19,700 |
| 2016 | $1,387 | $24,900 | $5,600 | $19,300 |
| 2015 | $1,387 | $24,100 | $11,169 | $12,931 |
| 2014 | $1,387 | $24,000 | $17,081 | $6,919 |
Source: Public Records
Map
Nearby Homes
- 3814 Coachlight Common St
- 6050 S Waverly Rd
- 2923 Newark Ave
- 5830 Granary Ln
- 5424 S Waverly Rd
- 6030 Piper Ave
- 5100 Wexford Rd
- 2616 Michigan 99
- 2416 Midwood St
- 4245 W Jolly Rd Unit 197
- 2045 Moffitt St
- 5838 S Martin Luther King Junior Blvd
- 4828 Ingham St
- 4809 Ballard Rd
- 3600 Ronald St
- 6037 Hughes Rd
- 2520 Renfrew Way
- 0 Midwood St
- 3115 Risdale Ave
- 5750 Ashley Dr
- 3423 Danbury Crossroad St
- 3433 Danbury Crossroad St
- 3423 Danbury
- 3419 Danbury Crossroad St
- 3546 Coachlight Common St
- 3552 Coachlight Common St
- 3552 Coachlight
- 3419 Danbury
- 3419 Dansbury
- 3439 Danbury Crossroad St
- 3556 Coachlight Common St
- 3424 Independence Ln
- 3430 Independence Ln
- 3418 Independence Ln
- 3413 Danbury Crossroad St
- 3426 Danbury Crossroad St
- 3420 Danbury Crossroad St
- 3434 Danbury Crossroad St
- 3562 Coachlight Common St
- 3412 Independence Ln