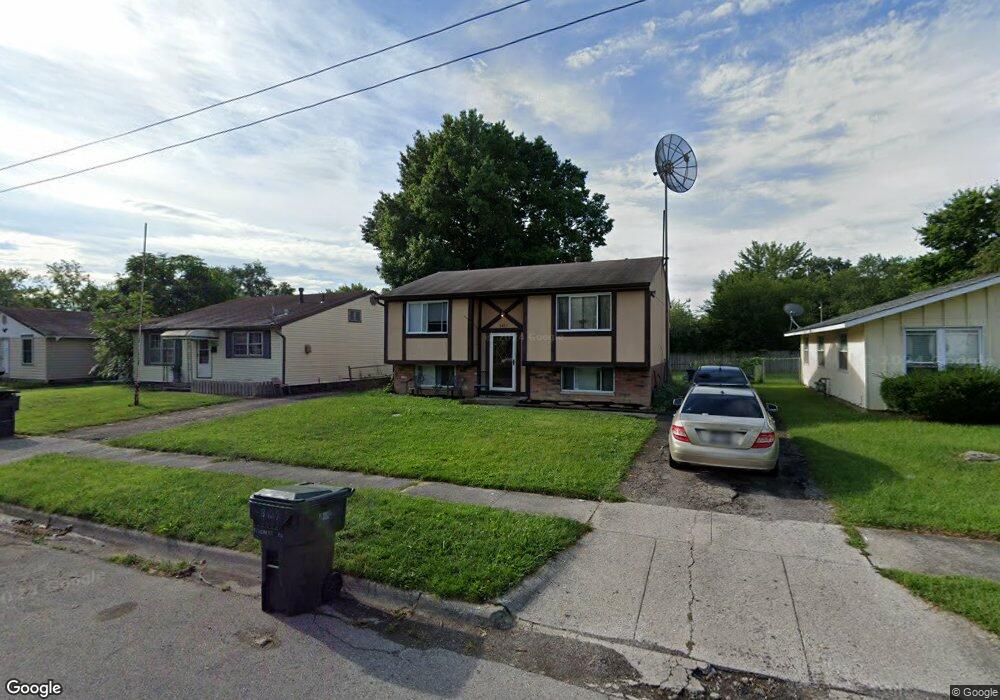
3427 Oakcrest Rd Columbus, OH 43232
Glenbrook NeighborhoodEstimated Value: $176,000 - $214,000
4
Beds
2
Baths
1,459
Sq Ft
$136/Sq Ft
Est. Value
About This Home
This home is located at 3427 Oakcrest Rd, Columbus, OH 43232 and is currently estimated at $197,813, approximately $135 per square foot. 3427 Oakcrest Rd is a home located in Franklin County with nearby schools including Easthaven Elementary School, Yorktown Middle School, and Independence High School.
Ownership History
Date
Name
Owned For
Owner Type
Purchase Details
Closed on
Oct 24, 2006
Sold by
Briley Mileah and Briley Ron
Bought by
Jones Sherry L
Current Estimated Value
Home Financials for this Owner
Home Financials are based on the most recent Mortgage that was taken out on this home.
Original Mortgage
$84,000
Outstanding Balance
$50,097
Interest Rate
6.45%
Mortgage Type
Purchase Money Mortgage
Estimated Equity
$147,716
Purchase Details
Closed on
Dec 29, 2000
Sold by
Moorer Aggie
Bought by
Golden Kyser Mileah
Home Financials for this Owner
Home Financials are based on the most recent Mortgage that was taken out on this home.
Original Mortgage
$75,460
Interest Rate
7.77%
Mortgage Type
FHA
Purchase Details
Closed on
Apr 8, 1998
Sold by
Moorer Aggie L
Bought by
Moorer Aggie and Aggie Moorer Revocable Living
Purchase Details
Closed on
Dec 14, 1990
Purchase Details
Closed on
Nov 2, 1990
Create a Home Valuation Report for This Property
The Home Valuation Report is an in-depth analysis detailing your home's value as well as a comparison with similar homes in the area
Home Values in the Area
Average Home Value in this Area
Purchase History
| Date | Buyer | Sale Price | Title Company |
|---|---|---|---|
| Jones Sherry L | $89,000 | Col Title | |
| Golden Kyser Mileah | $37,800 | Hummel Title Agency Inc | |
| Aggie Moorer Revocable Living Trust | $37,800 | Hummel Title Agency Inc | |
| Moorer Aggie | -- | -- | |
| -- | $21,500 | -- | |
| -- | -- | -- |
Source: Public Records
Mortgage History
| Date | Status | Borrower | Loan Amount |
|---|---|---|---|
| Open | Jones Sherry L | $84,000 | |
| Previous Owner | Golden Kyser Mileah | $75,460 |
Source: Public Records
Tax History Compared to Growth
Tax History
| Year | Tax Paid | Tax Assessment Tax Assessment Total Assessment is a certain percentage of the fair market value that is determined by local assessors to be the total taxable value of land and additions on the property. | Land | Improvement |
|---|---|---|---|---|
| 2024 | $2,603 | $55,720 | $16,450 | $39,270 |
| 2023 | $2,469 | $55,720 | $16,450 | $39,270 |
| 2022 | $1,382 | $26,640 | $6,340 | $20,300 |
| 2021 | $1,561 | $26,640 | $6,340 | $20,300 |
| 2020 | $1,386 | $26,640 | $6,340 | $20,300 |
| 2019 | $1,390 | $21,080 | $5,080 | $16,000 |
| 2018 | $1,262 | $21,080 | $5,080 | $16,000 |
| 2017 | $1,327 | $21,080 | $5,080 | $16,000 |
| 2016 | $1,375 | $20,760 | $3,960 | $16,800 |
| 2015 | $1,248 | $20,760 | $3,960 | $16,800 |
| 2014 | $1,251 | $20,760 | $3,960 | $16,800 |
| 2013 | $650 | $21,840 | $4,165 | $17,675 |
Source: Public Records
Map
Nearby Homes
- 3365 Bruceton Ave
- 2275 Cardston Ct
- 2252 Meridian Ct
- 2425 Mason Village Ct Unit 2425
- 3830 Charbonnett Ct Unit 6-A
- 2472 Nassau Dr Unit 37D
- 2509 Burgandy Ln Unit 46B
- 2503 Burgandy Ln Unit 46A
- 3811 Bay Village St
- 3054 Wadsworth Ct
- 3036 Wadsworth Ct
- 3038 Wadsworth Ct
- 1836 Penfield Ct S
- 0 Ravenswood Ct
- 3059 Remington Ridge Rd
- 3325 E Deshler Ave
- 2825 S Hampton Rd
- 1767 Alcoy Dr
- 2971 Queensrowe Dr
- 1664 Barnett Rd
- 3433 Oakcrest Rd
- 3419 Oakcrest Rd
- 3439 Oakcrest Rd
- 3413 Oakcrest Rd
- 3420 Bruceton Ave
- 3426 Bruceton Ave
- 3412 Bruceton Ave
- 3447 Oakcrest Rd
- 3407 Oakcrest Rd
- 3406 Bruceton Ave
- 3432 Bruceton Ave
- 2317 Cardston Dr
- 3424 Oakcrest Rd
- 3418 Oakcrest Rd
- 3400 Bruceton Ave
- 3453 Oakcrest Rd
- 3401 Oakcrest Rd
- 3450 Oakcrest Rd
- 3412 Oakcrest Rd
- 3438 Bruceton Ave