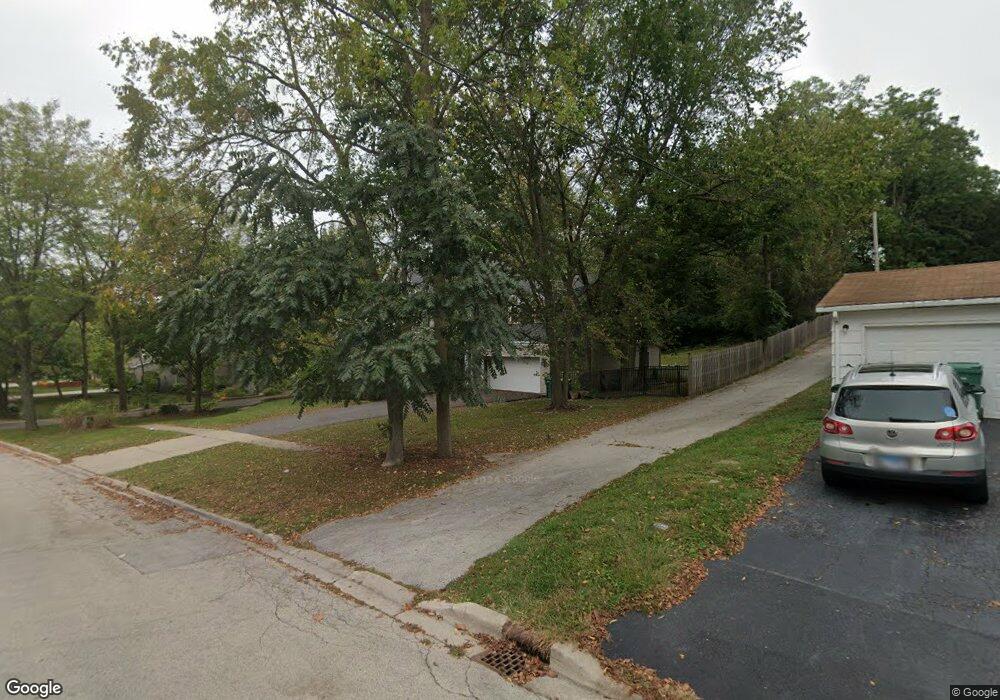
343 Logan St Lemont, IL 60439
Southeast Lemont NeighborhoodEstimated Value: $527,000 - $668,000
3
Beds
3
Baths
2,257
Sq Ft
$256/Sq Ft
Est. Value
About This Home
This home is located at 343 Logan St, Lemont, IL 60439 and is currently estimated at $577,841, approximately $256 per square foot. 343 Logan St is a home located in Cook County with nearby schools including Oakwood School, River Valley School, and Old Quarry Middle School.
Ownership History
Date
Name
Owned For
Owner Type
Purchase Details
Closed on
Jun 1, 2001
Sold by
Moose Construction Inc
Bought by
Digrazia Raymond and Casteel Deborah
Current Estimated Value
Home Financials for this Owner
Home Financials are based on the most recent Mortgage that was taken out on this home.
Original Mortgage
$320,400
Interest Rate
7.25%
Purchase Details
Closed on
Mar 28, 2000
Sold by
Bouche John F
Bought by
Charny Steven I and Charny Amy E
Home Financials for this Owner
Home Financials are based on the most recent Mortgage that was taken out on this home.
Original Mortgage
$500,000
Interest Rate
9%
Mortgage Type
Construction
Purchase Details
Closed on
Dec 8, 1999
Sold by
Bouche John F and Hill Denise J
Bought by
Bouche John F
Purchase Details
Closed on
May 17, 1999
Sold by
Kaput Joseph and Wagner Robert
Bought by
Bouche John F and Hill Denise J
Home Financials for this Owner
Home Financials are based on the most recent Mortgage that was taken out on this home.
Original Mortgage
$53,600
Interest Rate
7.54%
Create a Home Valuation Report for This Property
The Home Valuation Report is an in-depth analysis detailing your home's value as well as a comparison with similar homes in the area
Home Values in the Area
Average Home Value in this Area
Purchase History
| Date | Buyer | Sale Price | Title Company |
|---|---|---|---|
| Digrazia Raymond | $401,000 | -- | |
| Moose Construction Inc | -- | -- | |
| Charny Steven I | -- | -- | |
| Bouche John F | -- | -- | |
| Bouche John F | $61,000 | -- |
Source: Public Records
Mortgage History
| Date | Status | Borrower | Loan Amount |
|---|---|---|---|
| Previous Owner | Digrazia Raymond | $320,400 | |
| Previous Owner | Charny Steven I | $500,000 | |
| Previous Owner | Bouche John F | $53,600 | |
| Closed | Digrazia Raymond | $60,050 |
Source: Public Records
Tax History Compared to Growth
Tax History
| Year | Tax Paid | Tax Assessment Tax Assessment Total Assessment is a certain percentage of the fair market value that is determined by local assessors to be the total taxable value of land and additions on the property. | Land | Improvement |
|---|---|---|---|---|
| 2024 | $8,871 | $46,001 | $16,093 | $29,908 |
| 2023 | $8,475 | $46,001 | $16,093 | $29,908 |
| 2022 | $8,475 | $38,329 | $14,161 | $24,168 |
| 2021 | $8,237 | $38,329 | $14,161 | $24,168 |
| 2020 | $8,378 | $38,329 | $14,161 | $24,168 |
| 2019 | $8,683 | $40,970 | $14,161 | $26,809 |
| 2018 | $8,539 | $40,970 | $14,161 | $26,809 |
| 2017 | $8,425 | $40,970 | $14,161 | $26,809 |
| 2016 | $7,229 | $33,116 | $11,586 | $21,530 |
| 2015 | $7,307 | $33,116 | $11,586 | $21,530 |
| 2014 | $7,390 | $33,116 | $11,586 | $21,530 |
| 2013 | $7,745 | $36,701 | $11,586 | $25,115 |
Source: Public Records
Map
Nearby Homes
- 614 Czacki St
- 700 Czacki St
- 11174 Tuscany Ln
- 714 Walnut St
- 611 Houston St
- 414 Hillview Ct
- 606 Porter St
- 905 State St
- 906 State St
- 523 Talcott Ave
- 4 Ridge Rd
- 1 W Division St
- 15824 New Ave
- 1023 Walter St
- 1025 Walter St
- 15976 New Ave
- 1105 Walter St
- 1104 Walter St
- Fremont Plan at Covington Knolls
- Eden Plan at Covington Knolls