Estimated Value: $140,000 - $188,620
2
Beds
2
Baths
1,704
Sq Ft
$93/Sq Ft
Est. Value
About This Home
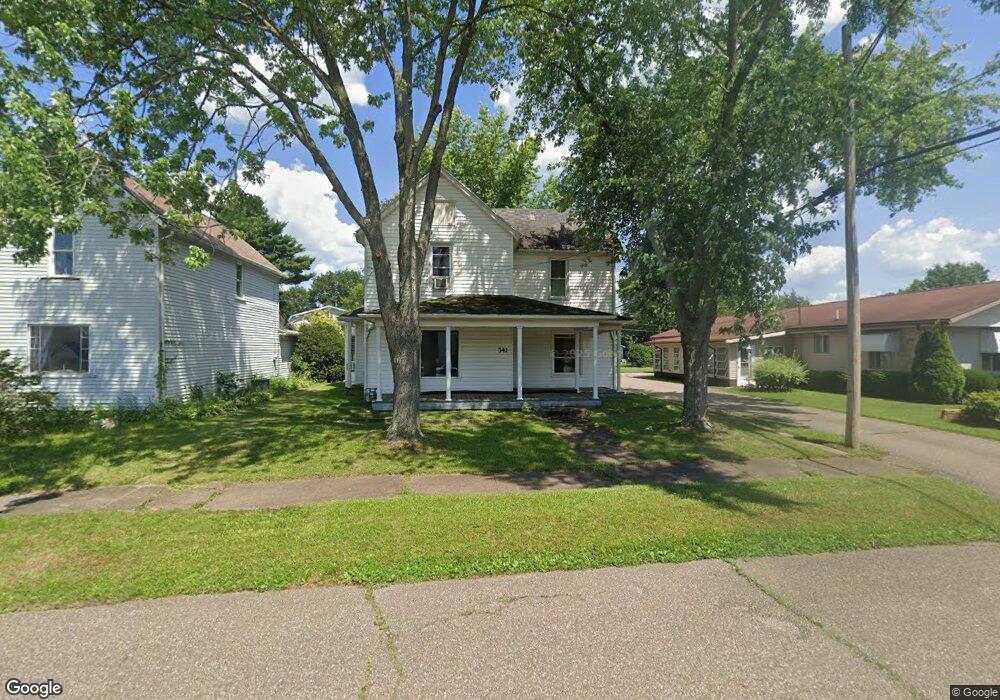
This home is located at 343 Main St, Dover, OH 44622 and is currently estimated at $157,905, approximately $92 per square foot. 343 Main St is a home located in Tuscarawas County with nearby schools including Dover High School and Tuscarawas Central Catholic Elementary School.
Ownership History
Date
Name
Owned For
Owner Type
Purchase Details
Closed on
Aug 24, 2016
Sold by
Hua Xiao Yan and Cheng Shao Ya
Bought by
Backlot Investments Llc
Current Estimated Value
Home Financials for this Owner
Home Financials are based on the most recent Mortgage that was taken out on this home.
Original Mortgage
$82,500
Outstanding Balance
$51,010
Interest Rate
3.48%
Mortgage Type
Future Advance Clause Open End Mortgage
Estimated Equity
$106,895
Purchase Details
Closed on
Dec 4, 2009
Sold by
Thompson J Douglas and Thompson Brandi L
Bought by
Xiao Yan Hua and Cheng Jian
Purchase Details
Closed on
Sep 14, 2005
Sold by
Mason Pauline M and Mason Daniel L
Bought by
Thompson J Douglas and Thompson Brandi L
Home Financials for this Owner
Home Financials are based on the most recent Mortgage that was taken out on this home.
Original Mortgage
$68,850
Interest Rate
5.93%
Mortgage Type
Fannie Mae Freddie Mac
Purchase Details
Closed on
Dec 18, 1987
Bought by
Mason Pauline M -Daniel L Maso
Create a Home Valuation Report for This Property
The Home Valuation Report is an in-depth analysis detailing your home's value as well as a comparison with similar homes in the area
Home Values in the Area
Average Home Value in this Area
Purchase History
| Date | Buyer | Sale Price | Title Company |
|---|---|---|---|
| Backlot Investments Llc | $70,000 | None Available | |
| Xiao Yan Hua | $60,000 | American Title | |
| Thompson J Douglas | $153,000 | American Title | |
| Mason Pauline M -Daniel L Maso | -- | -- |
Source: Public Records
Mortgage History
| Date | Status | Borrower | Loan Amount |
|---|---|---|---|
| Open | Backlot Investments Llc | $82,500 | |
| Previous Owner | Thompson J Douglas | $68,850 |
Source: Public Records
Tax History
| Year | Tax Paid | Tax Assessment Tax Assessment Total Assessment is a certain percentage of the fair market value that is determined by local assessors to be the total taxable value of land and additions on the property. | Land | Improvement |
|---|---|---|---|---|
| 2024 | $1,668 | $108,610 | $32,500 | $76,110 |
| 2023 | $1,668 | $108,610 | $32,500 | $76,110 |
| 2022 | $1,686 | $38,014 | $11,375 | $26,639 |
| 2021 | $1,559 | $33,016 | $9,293 | $23,723 |
| 2020 | $1,559 | $33,016 | $9,293 | $23,723 |
| 2019 | $1,570 | $33,016 | $9,293 | $23,723 |
| 2018 | $1,407 | $27,980 | $7,880 | $20,100 |
| 2017 | $1,407 | $27,980 | $7,880 | $20,100 |
| 2016 | $1,378 | $27,980 | $7,880 | $20,100 |
| 2014 | $1,185 | $26,180 | $7,880 | $18,300 |
| 2013 | $1,200 | $26,180 | $7,880 | $18,300 |
Source: Public Records
Map
Nearby Homes
- 120 Prospect St
- 118 Rear Prospect St
- 0 Oxford St Unit 5186285
- 605 Bond St
- 1126 Sherman Ave NW
- 214 Poplar St
- 212 Clubside Dr NW
- 334 W 4th St
- 856 Baker Ave NW
- 254 Ohio Ave NW
- 311 Lloyd St
- 919 Chelsea Dr
- 224 10th St NW
- 715 N Walnut St
- 1814 Saltwell Rd NW
- 913 Oak St NW
- 716 N Cross St
- 237 7th St NW
- 1109 E Front St
- 329 Park Ave NW
Your Personal Tour Guide
Ask me questions while you tour the home.