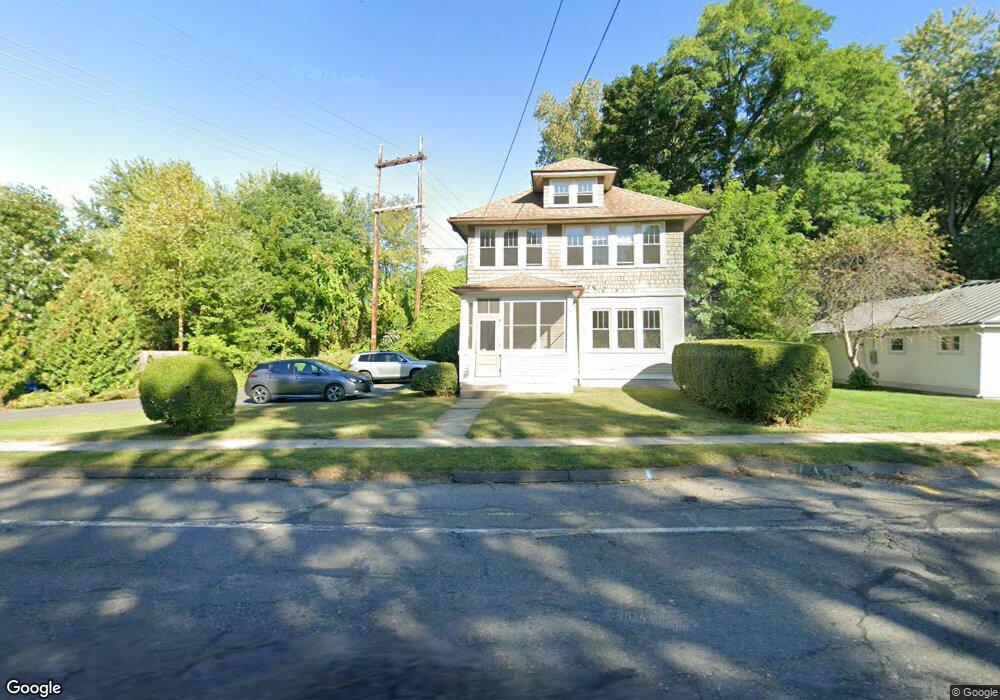
343 South St Northampton, MA 01060
Estimated Value: $433,000 - $620,000
3
Beds
2
Baths
2,252
Sq Ft
$232/Sq Ft
Est. Value
About This Home
This home is located at 343 South St, Northampton, MA 01060 and is currently estimated at $522,890, approximately $232 per square foot. 343 South St is a home located in Hampshire County with nearby schools including Northampton High School, Hilltown Cooperative Charter Public School, and The Montessori School of Northampton.
Ownership History
Date
Name
Owned For
Owner Type
Purchase Details
Closed on
Jun 14, 2019
Sold by
Duprey Nicholas D
Bought by
Duprey Nicholas D and Duprey Betty L
Current Estimated Value
Home Financials for this Owner
Home Financials are based on the most recent Mortgage that was taken out on this home.
Original Mortgage
$320,000
Outstanding Balance
$279,602
Interest Rate
4%
Mortgage Type
New Conventional
Estimated Equity
$243,288
Purchase Details
Closed on
Apr 2, 1996
Sold by
Duprey Nicholas D and Isaacson Mary T
Bought by
Duprey Nicholas D
Purchase Details
Closed on
Mar 31, 1995
Sold by
Scandale George J and Scandale Jean M
Bought by
Duprey Nicholas D and Isaacson Mary T
Home Financials for this Owner
Home Financials are based on the most recent Mortgage that was taken out on this home.
Original Mortgage
$96,000
Interest Rate
8.8%
Mortgage Type
Purchase Money Mortgage
Create a Home Valuation Report for This Property
The Home Valuation Report is an in-depth analysis detailing your home's value as well as a comparison with similar homes in the area
Home Values in the Area
Average Home Value in this Area
Purchase History
| Date | Buyer | Sale Price | Title Company |
|---|---|---|---|
| Duprey Nicholas D | -- | -- | |
| Duprey Nicholas D | $13,000 | -- | |
| Duprey Nicholas D | $121,000 | -- |
Source: Public Records
Mortgage History
| Date | Status | Borrower | Loan Amount |
|---|---|---|---|
| Open | Duprey Nicholas D | $320,000 | |
| Previous Owner | Duprey Nicholas D | $232,000 | |
| Previous Owner | Duprey Nicholas D | $96,000 |
Source: Public Records
Tax History Compared to Growth
Tax History
| Year | Tax Paid | Tax Assessment Tax Assessment Total Assessment is a certain percentage of the fair market value that is determined by local assessors to be the total taxable value of land and additions on the property. | Land | Improvement |
|---|---|---|---|---|
| 2025 | $5,871 | $421,500 | $121,400 | $300,100 |
| 2024 | $5,540 | $364,700 | $121,400 | $243,300 |
| 2023 | $5,474 | $345,600 | $110,300 | $235,300 |
| 2022 | $4,896 | $273,700 | $103,100 | $170,600 |
| 2021 | $4,541 | $261,400 | $98,000 | $163,400 |
| 2020 | $4,392 | $261,400 | $98,000 | $163,400 |
| 2019 | $4,209 | $242,300 | $91,900 | $150,400 |
| 2018 | $4,178 | $245,200 | $91,900 | $153,300 |
| 2017 | $4,092 | $245,200 | $91,900 | $153,300 |
| 2016 | $3,962 | $245,200 | $91,900 | $153,300 |
| 2015 | $3,964 | $250,900 | $96,000 | $154,900 |
| 2014 | $3,861 | $250,900 | $96,000 | $154,900 |
Source: Public Records
Map
Nearby Homes
- 56 Olive St
- 57 Columbus Ave
- 25 Munroe St
- 12 School St
- 86 Lyman Rd
- 35 New South St Unit 307
- 67 Old South St
- 244 Main St
- 49 Kensington Ave
- 43 Center St Unit K
- 218 Elm St
- 107 Williams St Unit 2c
- 107 Williams St Unit 3c
- 107 Williams St Unit A1
- 107 Williams St Unit 2B
- 30 Graves Ave Unit B
- 14 Arlington St
- 10 Hawley St Unit 4C
- 10 Hawley St Unit 4D
- 10 Hawley St Unit 4B