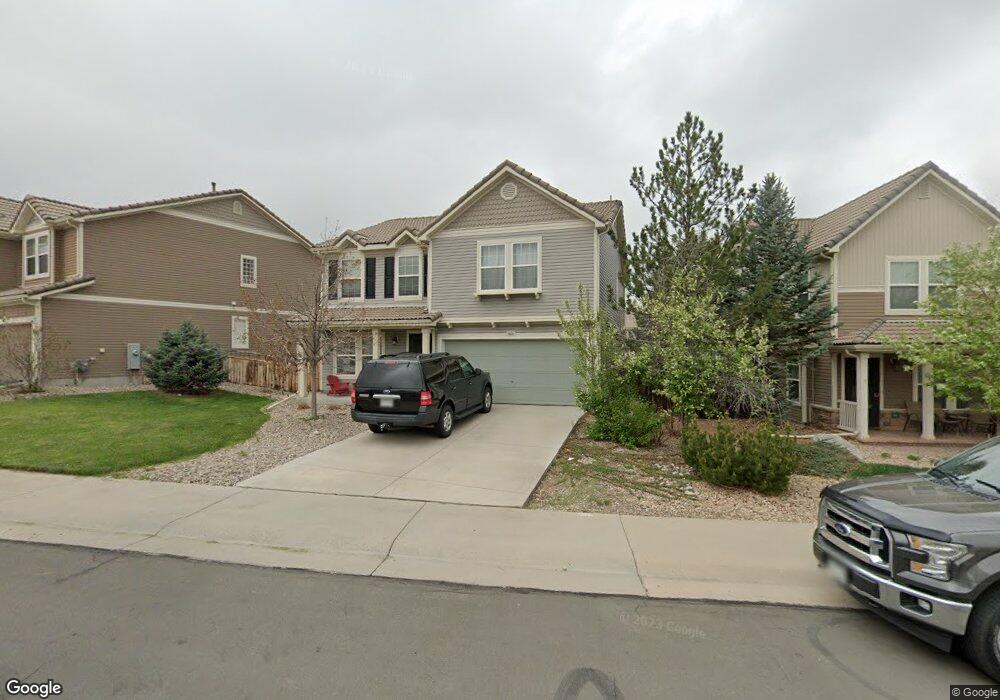
3432 Dinosaur St Castle Rock, CO 80109
The Meadows NeighborhoodEstimated Value: $576,000 - $593,000
3
Beds
3
Baths
2,200
Sq Ft
$266/Sq Ft
Est. Value
About This Home
This home is located at 3432 Dinosaur St, Castle Rock, CO 80109 and is currently estimated at $585,476, approximately $266 per square foot. 3432 Dinosaur St is a home located in Douglas County with nearby schools including Clear Sky Elementary School, Castle Rock Middle School, and Castle View High School.
Ownership History
Date
Name
Owned For
Owner Type
Purchase Details
Closed on
Mar 31, 2021
Sold by
Wright Family Trust
Bought by
Sorensen Shane D and Sorensen Kassidy M
Current Estimated Value
Home Financials for this Owner
Home Financials are based on the most recent Mortgage that was taken out on this home.
Original Mortgage
$408,000
Outstanding Balance
$367,180
Interest Rate
2.8%
Mortgage Type
New Conventional
Estimated Equity
$218,296
Purchase Details
Closed on
Jul 14, 2017
Sold by
Wright Jeremy W and Wright Nicole A
Bought by
Wright Jeremy W and Wright Nicole
Purchase Details
Closed on
Mar 7, 2008
Sold by
Oakwood Homes Llc
Bought by
Wright Jeremy W and Wright Nicole A
Home Financials for this Owner
Home Financials are based on the most recent Mortgage that was taken out on this home.
Original Mortgage
$240,951
Interest Rate
5.47%
Mortgage Type
FHA
Purchase Details
Closed on
Sep 30, 2005
Sold by
Hc Development & Management Services Inc
Bought by
Oakwood Homes Llc
Create a Home Valuation Report for This Property
The Home Valuation Report is an in-depth analysis detailing your home's value as well as a comparison with similar homes in the area
Home Values in the Area
Average Home Value in this Area
Purchase History
| Date | Buyer | Sale Price | Title Company |
|---|---|---|---|
| Sorensen Shane D | $480,000 | Unified Title Company | |
| Wright Jeremy W | -- | None Available | |
| Wright Jeremy W | $244,400 | Town & Country Title Service | |
| Oakwood Homes Llc | -- | -- |
Source: Public Records
Mortgage History
| Date | Status | Borrower | Loan Amount |
|---|---|---|---|
| Open | Sorensen Shane D | $408,000 | |
| Previous Owner | Wright Jeremy W | $240,951 |
Source: Public Records
Tax History Compared to Growth
Tax History
| Year | Tax Paid | Tax Assessment Tax Assessment Total Assessment is a certain percentage of the fair market value that is determined by local assessors to be the total taxable value of land and additions on the property. | Land | Improvement |
|---|---|---|---|---|
| 2024 | $3,737 | $39,530 | $8,730 | $30,800 |
| 2023 | $3,772 | $39,530 | $8,730 | $30,800 |
| 2022 | $2,792 | $27,470 | $6,410 | $21,060 |
| 2021 | $2,900 | $27,470 | $6,410 | $21,060 |
| 2020 | $2,795 | $27,110 | $5,320 | $21,790 |
| 2019 | $2,805 | $27,110 | $5,320 | $21,790 |
| 2018 | $2,500 | $23,760 | $4,890 | $18,870 |
| 2017 | $2,359 | $23,760 | $4,890 | $18,870 |
| 2016 | $2,184 | $21,630 | $5,040 | $16,590 |
| 2015 | $2,225 | $21,630 | $5,040 | $16,590 |
Source: Public Records
Map
Nearby Homes
- 1744 Hogan Ct
- 3607 Dinosaur St
- 3560 Starry Night Loop
- 3628 Sky Church Dr
- 1975 Hogan Ct
- 3334 Starry Night Loop
- 1479 Raindrop Way
- 2002 Quartz St
- 3871 Starry Night Loop
- 3868 Alcazar Dr
- 1648 Exquisite St
- 1385 Candleglow St
- 3934 Alcazar Dr
- 2307 Candleglow St
- 2199 Broadleaf Loop
- 1414 Freedom Way
- 1815 Avery Way
- 2175 Coach House Loop
- 1410 Exquisite St
- 2339 Robindale Way
- 3418 Dinosaur St
- 3476 Dinosaur St
- 3498 Dinosaur St
- 1752 Hogan Ct
- 1758 Hogan Ct
- 3427 Dinosaur St
- 3471 Dinosaur St
- 3530 Dinosaur St
- 3411 Dinosaur St
- 3487 Dinosaur St
- 1774 Hogan Ct
- 3505 Dinosaur St
- 3554 Dinosaur St
- 3523 Dinosaur St
- 1792 Hogan Ct
- 1739 Hogan Ct
- 3578 Dinosaur St
- 3547 Dinosaur St
- 1798 Hogan Ct
- 3565 Dinosaur St