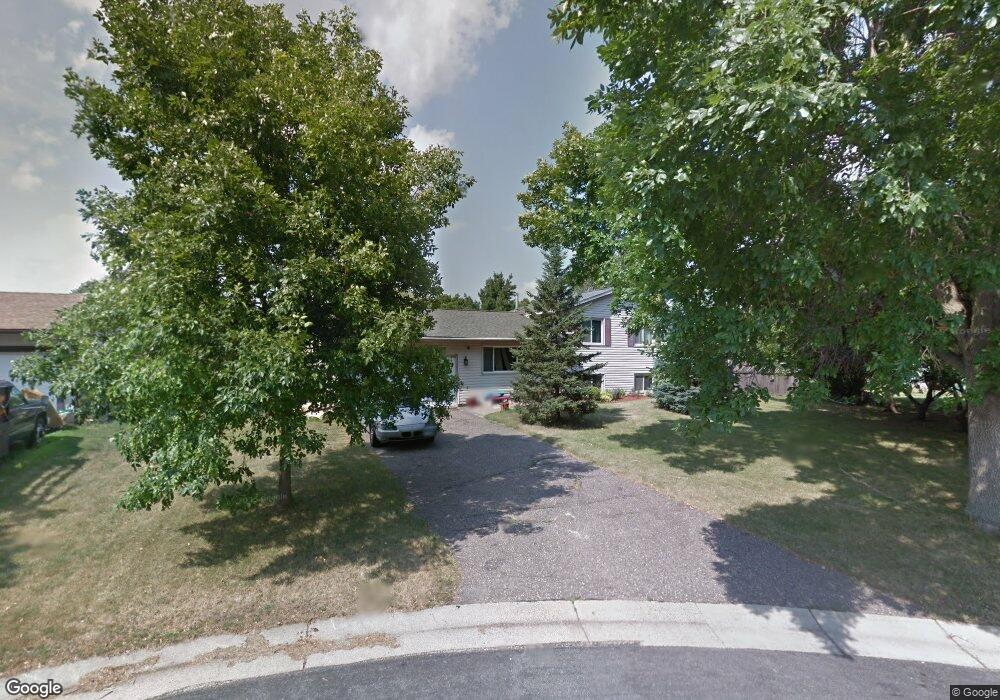
3433 Upper 149th Ct W Rosemount, MN 55068
Estimated Value: $318,000 - $353,000
3
Beds
2
Baths
912
Sq Ft
$374/Sq Ft
Est. Value
About This Home
This home is located at 3433 Upper 149th Ct W, Rosemount, MN 55068 and is currently estimated at $340,655, approximately $373 per square foot. 3433 Upper 149th Ct W is a home located in Dakota County with nearby schools including Rosemount Elementary School, Rosemount Middle School, and Rosemount Senior High School.
Ownership History
Date
Name
Owned For
Owner Type
Purchase Details
Closed on
Oct 3, 2017
Sold by
Garcia Sara Anne and Garcia Marwin
Bought by
Gilkey Andrew
Current Estimated Value
Home Financials for this Owner
Home Financials are based on the most recent Mortgage that was taken out on this home.
Original Mortgage
$211,105
Outstanding Balance
$176,568
Interest Rate
3.87%
Mortgage Type
FHA
Estimated Equity
$164,087
Purchase Details
Closed on
Nov 13, 2015
Sold by
Rauenhorst Elizabeth Anne and Rauenhorst Richard Elroy
Bought by
Ramirez Sara Anne
Purchase Details
Closed on
Sep 16, 2005
Sold by
Sovereign Bank
Bought by
Mellinger Elizabeth A
Purchase Details
Closed on
Mar 30, 2001
Sold by
Amick Beryram E
Bought by
Ochocki Jennifer M and Ochocki Timothy A
Purchase Details
Closed on
Aug 6, 1997
Sold by
Bauer Kathleen L and Bauer Patrick G
Bought by
Amick Bertram
Purchase Details
Closed on
Dec 2, 1996
Sold by
Bank Of America
Bought by
Bauer Kathleen L
Create a Home Valuation Report for This Property
The Home Valuation Report is an in-depth analysis detailing your home's value as well as a comparison with similar homes in the area
Home Values in the Area
Average Home Value in this Area
Purchase History
| Date | Buyer | Sale Price | Title Company |
|---|---|---|---|
| Gilkey Andrew | $215,000 | Eagle Creek Title | |
| Ramirez Sara Anne | -- | None Available | |
| Mellinger Elizabeth A | $195,000 | -- | |
| Ochocki Jennifer M | $137,500 | -- | |
| Amick Bertram | $77,795 | -- | |
| Bauer Kathleen L | $69,000 | -- |
Source: Public Records
Mortgage History
| Date | Status | Borrower | Loan Amount |
|---|---|---|---|
| Open | Gilkey Andrew | $211,105 |
Source: Public Records
Tax History Compared to Growth
Tax History
| Year | Tax Paid | Tax Assessment Tax Assessment Total Assessment is a certain percentage of the fair market value that is determined by local assessors to be the total taxable value of land and additions on the property. | Land | Improvement |
|---|---|---|---|---|
| 2024 | $3,234 | $299,400 | $83,500 | $215,900 |
| 2023 | $3,234 | $297,700 | $84,400 | $213,300 |
| 2022 | $2,756 | $297,800 | $84,000 | $213,800 |
| 2021 | $2,708 | $253,100 | $73,100 | $180,000 |
| 2020 | $2,590 | $244,000 | $69,400 | $174,600 |
| 2019 | $2,246 | $226,200 | $66,100 | $160,100 |
| 2018 | $2,204 | $208,400 | $63,000 | $145,400 |
| 2017 | $2,152 | $198,800 | $60,000 | $138,800 |
| 2016 | $2,084 | $187,500 | $58,300 | $129,200 |
| 2015 | $1,903 | $158,197 | $49,850 | $108,347 |
| 2014 | -- | $143,591 | $46,306 | $97,285 |
| 2013 | -- | $129,639 | $41,915 | $87,724 |
Source: Public Records
Map
Nearby Homes
- 13566 N Blackbird Way
- 14896 Cimarron Ave W
- 15245 Carrousel Way
- 3405 144th St W
- 15163 Claret Cir
- 15157 Crestone Cir
- 15400 Chippendale Ave W Unit 315
- 14575 Burma Ave W Unit 306
- 14575 Burma Ave W Unit 202
- 1232 Ardara Ridge Rd
- 15552 Cherry Path
- 3567 156th St W
- 3610 156th St W
- 1053 Aster Blvd
- 14648 Blueberry Ct
- 13702 Arrowhead Way
- 13842 Arrowhead Way
- 15149 December Trail
- 14840 Blanca Ave
- 4176 143rd St W
- 3427 Upper 149th Ct W
- 3441 Upper 149th Ct W
- 3410 148th St W
- 3377 Chevelle Ct W
- 3428 148th St W
- 3385 Chevelle Ct W
- 3447 Upper 149th Ct W
- 3421 Upper 149th Ct W
- 3392 148th St W Unit 98
- 3400 Upper 149th St W
- 14805 Chili Ave W
- 3465 Upper 149th Ct W
- 3369 Chevelle Ct W
- 3376 148th St W
- 3415 148th St W
- 3374-3376 148th St W
- 3374 148th St W
- 14903 Carol Ct
- 3361 Chevelle Ct W
- 14785 Chili Ave W