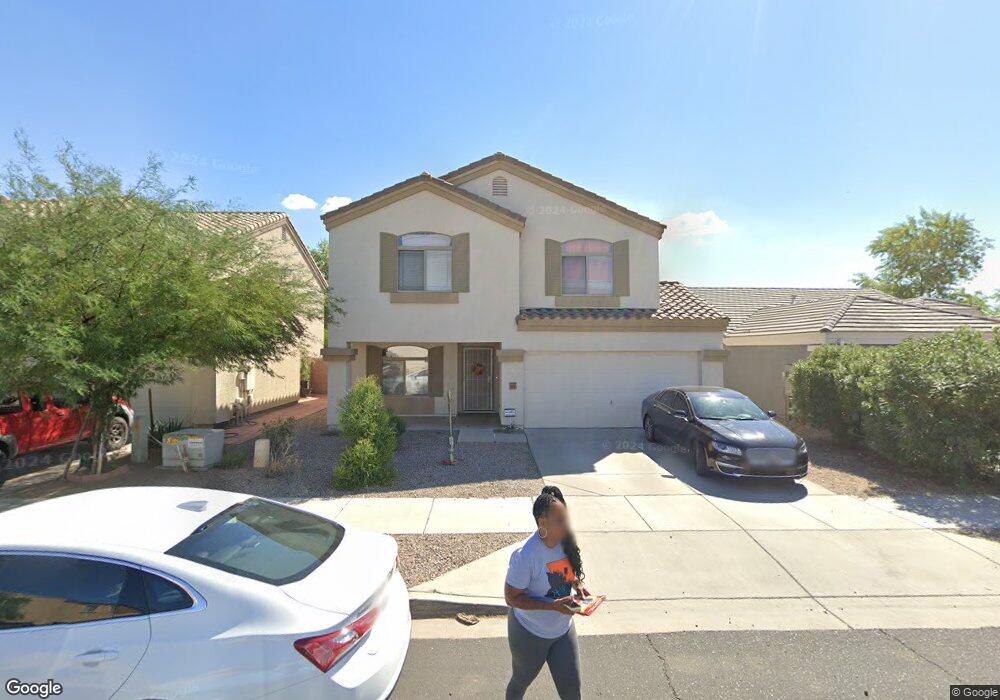
3433 W Fraktur Rd Phoenix, AZ 85041
Laveen NeighborhoodEstimated Value: $347,579 - $447,000
4
Beds
3
Baths
2,230
Sq Ft
$179/Sq Ft
Est. Value
About This Home
This home is located at 3433 W Fraktur Rd, Phoenix, AZ 85041 and is currently estimated at $400,145, approximately $179 per square foot. 3433 W Fraktur Rd is a home located in Maricopa County with nearby schools including Bernard Black Elementary School, Cesar Chavez High School, and Phoenix Coding Academy.
Ownership History
Date
Name
Owned For
Owner Type
Purchase Details
Closed on
Jun 23, 2017
Sold by
Su Pilien
Bought by
Su Pilien and Shen Chihni
Current Estimated Value
Purchase Details
Closed on
Sep 13, 2009
Sold by
Deutsche Bank Trust Company Americas
Bought by
Su Pilien
Purchase Details
Closed on
Jun 3, 2009
Sold by
Doan Au Long
Bought by
Deutsche Bank Trust Company Americas
Purchase Details
Closed on
Oct 4, 2005
Sold by
Ngo Trinh Tuyet
Bought by
Doan Au Long
Home Financials for this Owner
Home Financials are based on the most recent Mortgage that was taken out on this home.
Original Mortgage
$230,400
Interest Rate
6.37%
Mortgage Type
Purchase Money Mortgage
Purchase Details
Closed on
Jun 23, 2005
Sold by
Hoang Tracy
Bought by
Nguyen Steven
Create a Home Valuation Report for This Property
The Home Valuation Report is an in-depth analysis detailing your home's value as well as a comparison with similar homes in the area
Home Values in the Area
Average Home Value in this Area
Purchase History
| Date | Buyer | Sale Price | Title Company |
|---|---|---|---|
| Su Pilien | -- | None Available | |
| Su Pilien | $86,000 | Fidelity Natl Title Ins Co | |
| Deutsche Bank Trust Company Americas | $242,286 | Security Title Agency | |
| Doan Au Long | -- | First American Title Ins Co | |
| Doan Au Long | $288,000 | First American Title Ins Co | |
| Nguyen Steven | -- | Dhi Title Of Arizona Inc | |
| Nguyen Steven | $190,216 | Dhi Title Of Arizona Inc |
Source: Public Records
Mortgage History
| Date | Status | Borrower | Loan Amount |
|---|---|---|---|
| Previous Owner | Doan Au Long | $230,400 |
Source: Public Records
Tax History Compared to Growth
Tax History
| Year | Tax Paid | Tax Assessment Tax Assessment Total Assessment is a certain percentage of the fair market value that is determined by local assessors to be the total taxable value of land and additions on the property. | Land | Improvement |
|---|---|---|---|---|
| 2025 | $1,979 | $13,471 | -- | -- |
| 2024 | $1,922 | $12,829 | -- | -- |
| 2023 | $1,922 | $27,960 | $5,590 | $22,370 |
| 2022 | $1,884 | $20,980 | $4,190 | $16,790 |
| 2021 | $1,922 | $19,680 | $3,930 | $15,750 |
| 2020 | $1,899 | $17,630 | $3,520 | $14,110 |
| 2019 | $1,837 | $15,630 | $3,120 | $12,510 |
| 2018 | $1,788 | $15,170 | $3,030 | $12,140 |
| 2017 | $1,704 | $13,380 | $2,670 | $10,710 |
| 2016 | $1,620 | $12,200 | $2,440 | $9,760 |
| 2015 | $1,525 | $10,560 | $2,110 | $8,450 |
Source: Public Records
Map
Nearby Homes
- 3338 W Sunland Ave
- 3433 W Chambers St
- 3434 W Chambers St
- 3313 W Wayland Dr
- 3622 W Sunland Ave
- 3228 W Wayland Dr
- 3233 W Pleasant Ln
- 3410 W T Ryan Ln
- 5012 S 35th Dr
- 3042 W Fraktur Rd
- 3327 W Leodra Ln
- 3747 W Atlanta Ave
- 3443 W Saint Anne Ave
- 3232 W Saint Anne Ave
- 3412 W Apollo Rd
- 3731 W Wier Ave
- 3201 W Saint Catherine Ave
- 3927 W Southern Ave
- 2909 W Bowker St
- 4001 W Southern Ave Unit 50
- 3437 W Fraktur Rd
- 3429 W Fraktur Rd
- 3425 W Fraktur Rd
- 3421 W Fraktur Rd
- 3426 W Wayland Dr
- 3432 W Fraktur Rd
- 3436 W Fraktur Rd
- 3422 W Fraktur Rd
- 3440 W Fraktur Rd
- 3417 W Fraktur Rd
- 3424 W Fraktur Rd
- 3444 W Fraktur Rd
- 3418 W Wayland Dr Unit 1
- 3420 W Fraktur Rd
- 3413 W Fraktur Rd
- 3414 W Wayland Dr Unit 1
- 3416 W Fraktur Rd
- 3409 W Fraktur Rd
- 3435 W Sunland Ave