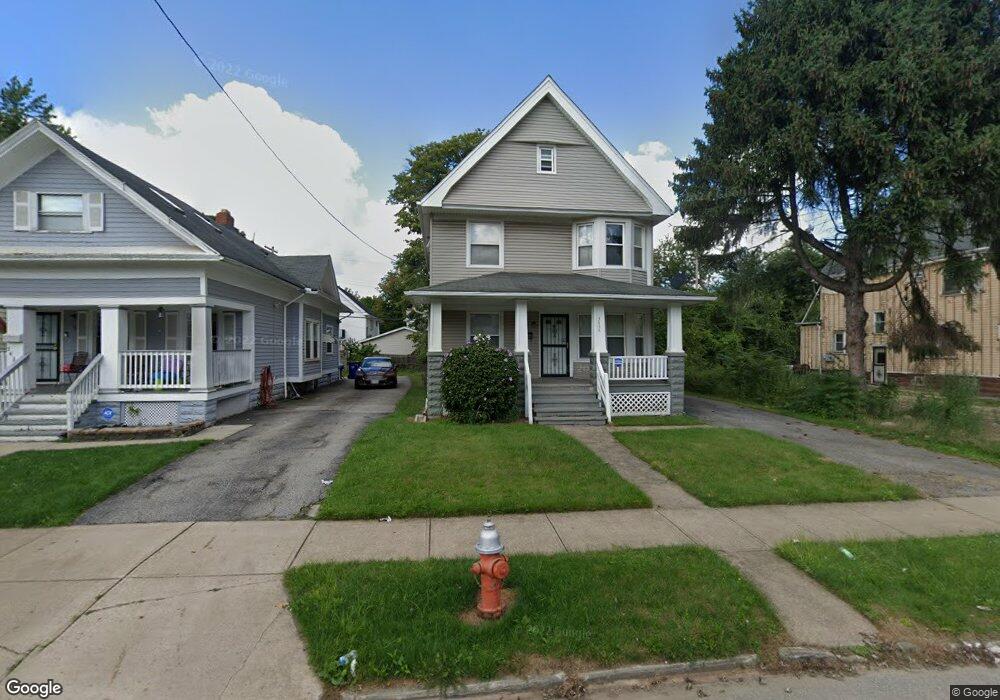
3434 E 103rd St Cleveland, OH 44104
Union-Miles Park NeighborhoodEstimated Value: $75,198 - $96,000
4
Beds
2
Baths
1,884
Sq Ft
$47/Sq Ft
Est. Value
About This Home
This home is located at 3434 E 103rd St, Cleveland, OH 44104 and is currently estimated at $88,300, approximately $46 per square foot. 3434 E 103rd St is a home located in Cuyahoga County with nearby schools including Village Preparatory Academy: Woodland Hills Campus, Wings Academy 1, and Benedictine High School.
Ownership History
Date
Name
Owned For
Owner Type
Purchase Details
Closed on
Feb 17, 2015
Sold by
Cleveland Housing Network Inc
Bought by
Qunnie Joanne
Current Estimated Value
Home Financials for this Owner
Home Financials are based on the most recent Mortgage that was taken out on this home.
Original Mortgage
$8,000
Outstanding Balance
$6,118
Interest Rate
3.72%
Mortgage Type
Future Advance Clause Open End Mortgage
Estimated Equity
$82,182
Purchase Details
Closed on
Jan 2, 2014
Sold by
Cleveland Housing Network Limited Partne
Bought by
Cleveland Housing Network Inc
Purchase Details
Closed on
Jun 7, 1999
Sold by
Cleveland Housing Network Inc
Bought by
Cleveland Housing Network Ltd Prtnrshp
Purchase Details
Closed on
Dec 17, 1996
Sold by
Byrd Phillip H and Byrd Joyce M
Bought by
Hud
Purchase Details
Closed on
Jan 1, 1975
Bought by
Byrd Phillip H and Byrd Joyce M
Create a Home Valuation Report for This Property
The Home Valuation Report is an in-depth analysis detailing your home's value as well as a comparison with similar homes in the area
Home Values in the Area
Average Home Value in this Area
Purchase History
| Date | Buyer | Sale Price | Title Company |
|---|---|---|---|
| Qunnie Joanne | $19,750 | American Family Title Agency | |
| Cleveland Housing Network Inc | -- | American Family Title Agency | |
| Cleveland Housing Network Ltd Prtnrshp | -- | Rockwell Title Agency Inc | |
| Hud | $15,394 | -- | |
| Byrd Phillip H | -- | -- |
Source: Public Records
Mortgage History
| Date | Status | Borrower | Loan Amount |
|---|---|---|---|
| Open | Qunnie Joanne | $8,000 |
Source: Public Records
Tax History
| Year | Tax Paid | Tax Assessment Tax Assessment Total Assessment is a certain percentage of the fair market value that is determined by local assessors to be the total taxable value of land and additions on the property. | Land | Improvement |
|---|---|---|---|---|
| 2024 | $1,255 | $19,145 | $3,220 | $15,925 |
| 2023 | $789 | $10,400 | $2,100 | $8,300 |
| 2022 | $784 | $10,400 | $2,100 | $8,300 |
| 2021 | $776 | $10,400 | $2,100 | $8,300 |
| 2020 | $774 | $8,960 | $1,820 | $7,140 |
| 2019 | $715 | $25,600 | $5,200 | $20,400 |
| 2018 | $722 | $8,960 | $1,820 | $7,140 |
| 2017 | $737 | $8,720 | $1,680 | $7,040 |
| 2016 | $732 | $8,720 | $1,680 | $7,040 |
| 2015 | $864 | $8,720 | $1,680 | $7,040 |
| 2014 | $864 | $10,260 | $1,960 | $8,300 |
Source: Public Records
Map
Nearby Homes
- 3452 E 104th St
- 3486 E 105th St
- 3453 E 105th St
- 3531 E 104th St
- 3367 E 102nd St
- 9618 Raymond Ave
- 9521 Union Ave
- 3542 E 108th St
- 9516 Marah Ave
- 3591 E 104th St
- 3535 E 108th St
- 9617 Marah Ave
- 3566 E 108th St
- 9502 Raymond Ave
- 3540 E 110th St
- 3544 E 110th St
- 3552 E 110th St
- 3525 E 110th St
- 0 Beacon Ave
- 3272 E 103rd St
- 3430 E 103rd St
- 3438 E 103rd St
- 3442 E 103rd St
- 3426 E 103rd St
- 3422 E 103rd St
- 3446 E 103rd St
- 3431 E 102nd St
- 3427 E 102nd St
- 3439 E 102nd St
- 3423 E 102nd St
- 3443 E 102nd St
- 3450 E 103rd St
- 3418 E 103rd St
- 3433 E 103rd St
- 3429 E 103rd St
- 3425 E 103rd St
- 3447 E 102nd St
- 3421 E 103rd St
- 3454 E 103rd St
- 3419 E 102nd St
Your Personal Tour Guide
Ask me questions while you tour the home.