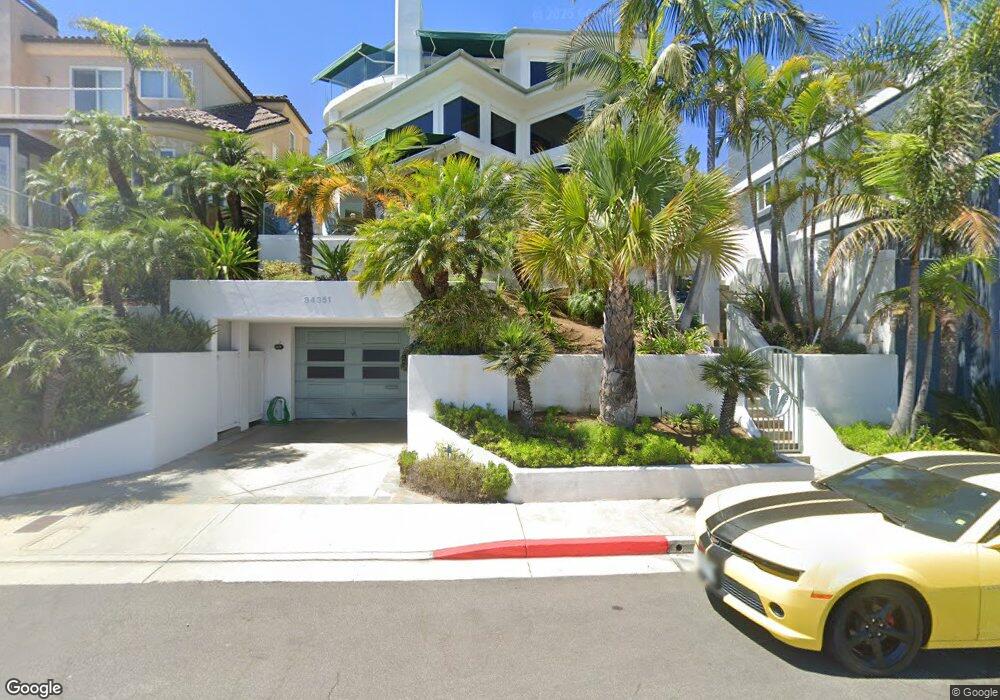
34351 Green Lantern St Dana Point, CA 92629
Lantern Village NeighborhoodEstimated Value: $4,202,000 - $6,200,084
4
Beds
4
Baths
4,768
Sq Ft
$1,099/Sq Ft
Est. Value
About This Home
This home is located at 34351 Green Lantern St, Dana Point, CA 92629 and is currently estimated at $5,239,771, approximately $1,098 per square foot. 34351 Green Lantern St is a home with nearby schools including Richard Henry Dana Elementary School, Marco Forster Middle School, and Dana Hills High School.
Ownership History
Date
Name
Owned For
Owner Type
Purchase Details
Closed on
Feb 4, 2003
Sold by
Lindl Robert G and Lindl Rona S
Bought by
Lindl Robert G and Lindl Robert S
Current Estimated Value
Home Financials for this Owner
Home Financials are based on the most recent Mortgage that was taken out on this home.
Original Mortgage
$1,500,000
Outstanding Balance
$633,031
Interest Rate
5.75%
Estimated Equity
$4,606,740
Purchase Details
Closed on
Oct 17, 2000
Sold by
Robert Lindl and Robert Rona
Bought by
Lindl Robert G and Lindl Rona S
Purchase Details
Closed on
Jul 7, 1999
Sold by
Robert Lindl
Bought by
Lindl Robert G and Lindl Rona S
Home Financials for this Owner
Home Financials are based on the most recent Mortgage that was taken out on this home.
Original Mortgage
$1,285,000
Interest Rate
7.24%
Mortgage Type
Construction
Purchase Details
Closed on
Aug 19, 1996
Sold by
Lucarelli Roxie M and Lucarelli Terry B
Bought by
Lindl Robert and Lindl Rona
Create a Home Valuation Report for This Property
The Home Valuation Report is an in-depth analysis detailing your home's value as well as a comparison with similar homes in the area
Home Values in the Area
Average Home Value in this Area
Purchase History
| Date | Buyer | Sale Price | Title Company |
|---|---|---|---|
| Lindl Robert G | -- | Fidelity National Title | |
| Lindl Robert G | -- | Fidelity National Title | |
| Lindl Robert G | -- | -- | |
| Lindl Robert G | -- | Fidelity National Title | |
| Lindl Robert | $355,000 | Continental Lawyers Title Co |
Source: Public Records
Mortgage History
| Date | Status | Borrower | Loan Amount |
|---|---|---|---|
| Open | Lindl Robert G | $1,500,000 | |
| Closed | Lindl Robert G | $1,285,000 |
Source: Public Records
Tax History Compared to Growth
Tax History
| Year | Tax Paid | Tax Assessment Tax Assessment Total Assessment is a certain percentage of the fair market value that is determined by local assessors to be the total taxable value of land and additions on the property. | Land | Improvement |
|---|---|---|---|---|
| 2025 | $20,757 | $1,876,866 | $578,194 | $1,298,672 |
| 2024 | $20,757 | $1,840,065 | $566,857 | $1,273,208 |
| 2023 | $20,352 | $1,803,986 | $555,742 | $1,248,244 |
| 2022 | $19,820 | $1,768,614 | $544,845 | $1,223,769 |
| 2021 | $19,467 | $1,733,936 | $534,162 | $1,199,774 |
| 2020 | $18,877 | $1,716,157 | $528,685 | $1,187,472 |
| 2019 | $18,467 | $1,682,507 | $518,318 | $1,164,189 |
| 2018 | $18,178 | $1,649,517 | $508,155 | $1,141,362 |
| 2017 | $17,732 | $1,617,174 | $498,191 | $1,118,983 |
| 2016 | $17,351 | $1,585,465 | $488,422 | $1,097,043 |
| 2015 | $16,728 | $1,561,650 | $481,085 | $1,080,565 |
| 2014 | $16,426 | $1,531,060 | $471,661 | $1,059,399 |
Source: Public Records
Map
Nearby Homes
- 34412 St of the Green Lant
- 31 Shoreline Dr
- 35 Shoreline Dr
- 5 Pacific Ridge Place
- 24242 Santa Clara Ave Unit 31
- 17 Pacific Ridge Place
- 83 Palm Beach Ct
- 34365 Dana Strand Rd Unit 3
- 34132 Selva Rd Unit 252
- 34381 Dana Strand Rd
- 27 Palm Beach Ct
- 34385 Dana Strand Rd Unit B
- 1 Beach View Ave
- 5 Oceanfront Ln
- 11 Beach View Ave
- 24545 Santa Clara Ave Unit 11
- 34022 Selva Rd Unit 52
- 34014 Selva Rd Unit 18
- 34071 Amber Lantern St
- 34021 La Serena Dr
- 34361 Green Lantern St
- 34331 Green Lantern St Unit 4
- 34331 Green Lantern St Unit 2
- 34331 Green Lantern St
- 34401 Green Lantern St
- 34382 Green Lantern St
- 34371 Green Lantern St
- 34371 St of the Green Lant
- 34371 St of the Green Lant Unit B
- 34396 Green Lantern St
- 34405 Green Lantern St Unit 1
- 34403 Green Lantern St Unit 2
- 34402 Green Lantern St
- 0 Street of Green Lantern Unit LG18072261
- 0 Street of Green Lantern Unit 17-271584
- 0 Street of Green Lantern Unit OC22008287
- 0 Street of Green Lantern Unit LG20153536
- 0 Street of Green Lantern Unit LG19047345
- 34386 Green Lantern St
- 34344 Street of the Green Lantern