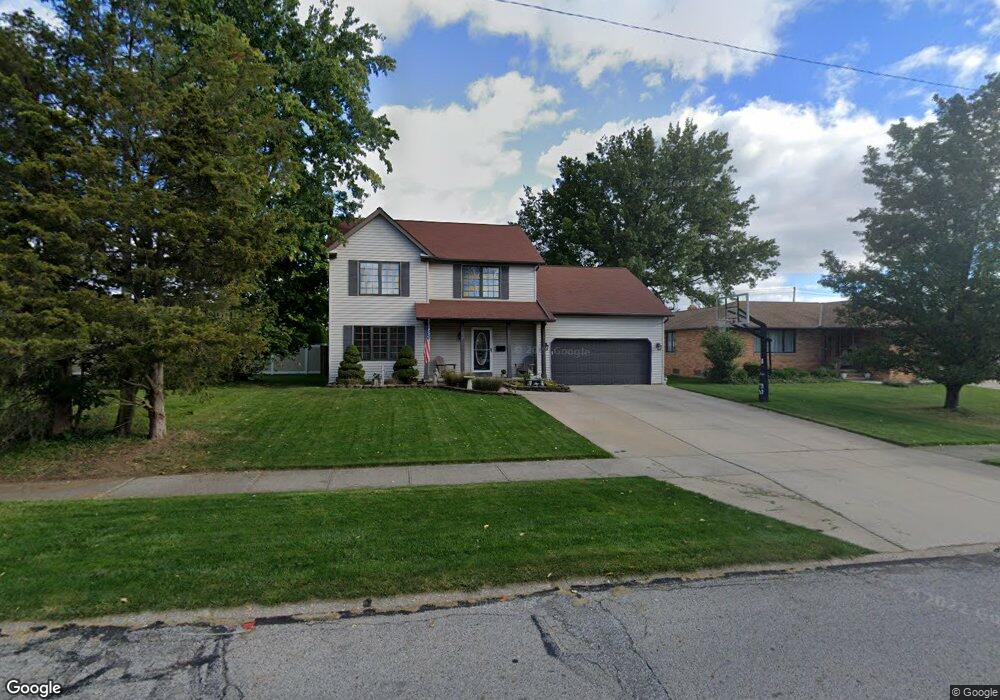
3436 Coventry Dr Cleveland, OH 44134
Estimated Value: $358,000 - $375,000
4
Beds
3
Baths
2,416
Sq Ft
$151/Sq Ft
Est. Value
About This Home
This home is located at 3436 Coventry Dr, Cleveland, OH 44134 and is currently estimated at $365,483, approximately $151 per square foot. 3436 Coventry Dr is a home located in Cuyahoga County with nearby schools including Dentzler Elementary School, Normandy High School, and Hillside Middle School.
Ownership History
Date
Name
Owned For
Owner Type
Purchase Details
Closed on
Mar 13, 2002
Sold by
Capricorn Building Company
Bought by
Colovas Soc and Colovas Mary Anne
Current Estimated Value
Home Financials for this Owner
Home Financials are based on the most recent Mortgage that was taken out on this home.
Original Mortgage
$137,500
Outstanding Balance
$57,639
Interest Rate
7.11%
Mortgage Type
Purchase Money Mortgage
Estimated Equity
$307,844
Purchase Details
Closed on
Aug 7, 2001
Sold by
Dengler Jeffrey A
Bought by
Capricorn Building Company
Home Financials for this Owner
Home Financials are based on the most recent Mortgage that was taken out on this home.
Original Mortgage
$2,000,000
Interest Rate
7.15%
Purchase Details
Closed on
Jul 14, 1994
Sold by
Vizdos Mary Ann
Bought by
Dengler Jeffrey A and Dengler Susan T
Purchase Details
Closed on
Jun 14, 1988
Sold by
Tusick Steve G
Bought by
Tusiek Helen M 2 and Tusiek 3
Purchase Details
Closed on
Jan 1, 1975
Bought by
Tusick Steve G
Create a Home Valuation Report for This Property
The Home Valuation Report is an in-depth analysis detailing your home's value as well as a comparison with similar homes in the area
Home Values in the Area
Average Home Value in this Area
Purchase History
| Date | Buyer | Sale Price | Title Company |
|---|---|---|---|
| Colovas Soc | $197,500 | -- | |
| Capricorn Building Company | -- | -- | |
| Dengler Jeffrey A | $27,000 | -- | |
| Tusiek Helen M 2 | -- | -- | |
| Tusick Steve G | -- | -- |
Source: Public Records
Mortgage History
| Date | Status | Borrower | Loan Amount |
|---|---|---|---|
| Open | Colovas Soc | $137,500 | |
| Closed | Capricorn Building Company | $2,000,000 |
Source: Public Records
Tax History Compared to Growth
Tax History
| Year | Tax Paid | Tax Assessment Tax Assessment Total Assessment is a certain percentage of the fair market value that is determined by local assessors to be the total taxable value of land and additions on the property. | Land | Improvement |
|---|---|---|---|---|
| 2024 | $7,055 | $120,820 | $13,790 | $107,030 |
| 2023 | $5,656 | $82,640 | $11,340 | $71,300 |
| 2022 | $5,608 | $82,635 | $11,340 | $71,295 |
| 2021 | $5,779 | $82,640 | $11,340 | $71,300 |
| 2020 | $5,471 | $69,440 | $9,520 | $59,920 |
| 2019 | $5,273 | $198,400 | $27,200 | $171,200 |
| 2018 | $5,134 | $69,440 | $9,520 | $59,920 |
| 2017 | $5,144 | $62,900 | $8,750 | $54,150 |
| 2016 | $5,112 | $62,900 | $8,750 | $54,150 |
| 2015 | $5,092 | $62,900 | $8,750 | $54,150 |
| 2014 | $5,092 | $64,860 | $9,030 | $55,830 |
Source: Public Records
Map
Nearby Homes
- 3200 Dentzler Rd
- 7180 Marko Ln
- 4402 Stary Dr
- 3610 Jeanne Dr
- 2644 Nottingham Dr
- 4803 Sassafras Dr
- 7558 Pleasant View Dr
- 7030 Lyle Ave
- 3195 Marda Dr
- 3262 Marda Dr
- 2800 Bonny Blvd
- 7531 Vista Dr
- 3711 Klusner Ave
- 3807 Klusner Ave
- 2838 Marda Dr
- 3011 Klusner Ave
- 2830 Brian Dr
- 3350 Saint Andrews Dr
- 3430 Park Dr
- 4440 Coral Gables Dr