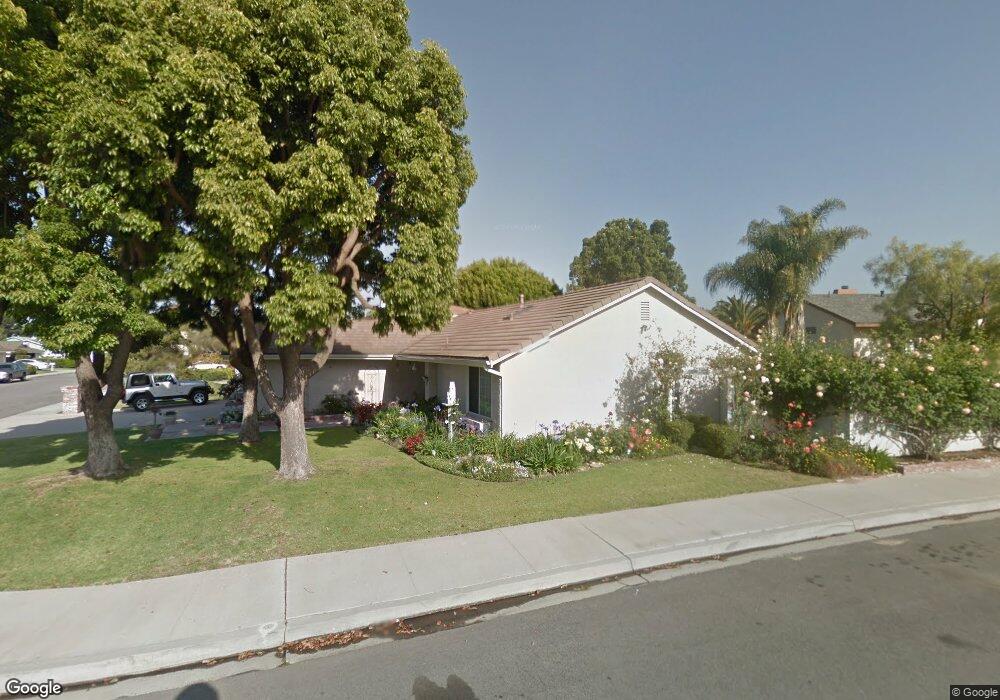
3437 Canoga Place Camarillo, CA 93010
Estimated Value: $744,686 - $898,000
3
Beds
2
Baths
1,338
Sq Ft
$619/Sq Ft
Est. Value
About This Home
This home is located at 3437 Canoga Place, Camarillo, CA 93010 and is currently estimated at $828,422, approximately $619 per square foot. 3437 Canoga Place is a home located in Ventura County with nearby schools including Dos Caminos Elementary School, Las Colinas Middle School, and Adolfo Camarillo High School.
Ownership History
Date
Name
Owned For
Owner Type
Purchase Details
Closed on
Jan 18, 2012
Sold by
Inouye Alida H
Bought by
Inouye Alida H
Current Estimated Value
Home Financials for this Owner
Home Financials are based on the most recent Mortgage that was taken out on this home.
Original Mortgage
$308,000
Interest Rate
3.88%
Mortgage Type
New Conventional
Purchase Details
Closed on
Sep 7, 2011
Sold by
Inouye Alida H
Bought by
Inouye Alida H
Purchase Details
Closed on
Aug 2, 2011
Sold by
Inouye Alida H
Bought by
Inouye Alida H
Purchase Details
Closed on
Mar 12, 2009
Sold by
Inouye Alida H
Bought by
Inouye Alida H
Home Financials for this Owner
Home Financials are based on the most recent Mortgage that was taken out on this home.
Original Mortgage
$319,000
Interest Rate
5.19%
Mortgage Type
New Conventional
Purchase Details
Closed on
Apr 19, 2002
Sold by
Inouye Alida H
Bought by
Inouye Alida H
Create a Home Valuation Report for This Property
The Home Valuation Report is an in-depth analysis detailing your home's value as well as a comparison with similar homes in the area
Home Values in the Area
Average Home Value in this Area
Purchase History
| Date | Buyer | Sale Price | Title Company |
|---|---|---|---|
| Inouye Alida H | -- | Accommodation | |
| Inouye Alida H | -- | Advantage Title Inc | |
| Inouye Alida H | -- | None Available | |
| Inouye Alida H | -- | None Available | |
| Inouye Alida H | -- | Accommodation | |
| Inouye Alida H | -- | Accommodation | |
| Inouye Alida H | -- | -- |
Source: Public Records
Mortgage History
| Date | Status | Borrower | Loan Amount |
|---|---|---|---|
| Closed | Inouye Alida H | $308,000 | |
| Closed | Inouye Alida H | $319,000 |
Source: Public Records
Tax History Compared to Growth
Tax History
| Year | Tax Paid | Tax Assessment Tax Assessment Total Assessment is a certain percentage of the fair market value that is determined by local assessors to be the total taxable value of land and additions on the property. | Land | Improvement |
|---|---|---|---|---|
| 2025 | $2,795 | $255,877 | $89,545 | $166,332 |
| 2024 | $2,795 | $250,860 | $87,789 | $163,071 |
| 2023 | $2,695 | $245,942 | $86,068 | $159,874 |
| 2022 | $2,685 | $241,120 | $84,380 | $156,740 |
| 2021 | $2,588 | $236,393 | $82,726 | $153,667 |
| 2020 | $2,578 | $233,972 | $81,879 | $152,093 |
| 2019 | $2,564 | $229,385 | $80,274 | $149,111 |
| 2018 | $2,516 | $224,888 | $78,700 | $146,188 |
| 2017 | $2,369 | $220,479 | $77,157 | $143,322 |
| 2016 | $2,311 | $216,157 | $75,645 | $140,512 |
| 2015 | $2,286 | $212,911 | $74,509 | $138,402 |
| 2014 | $2,233 | $208,742 | $73,050 | $135,692 |
Source: Public Records
Map
Nearby Homes
- 1690 Loma Dr
- 1492 Via Bonito
- 2875 Munson St
- 861 Dara St
- 1775 Temple Ave
- 744 Sharon Dr
- 2857 Via Descanso
- 2533 Antonio Dr Unit 302
- 2854 Via Descanso
- 2860 Via Descanso
- 2052 Santo Domingo
- 232 Talud Terrace Unit 19
- 2722 Antonio Dr
- 2255 Placita San Rufino
- 135 Tranquila Dr Unit 61
- 2576 Villamonte Ct
- 2713 Antonio Dr Unit 110
- 2713 Antonio Dr Unit 108
- 2713 Antonio Dr Unit 105
- 4718 La Puma Ct
- 3417 Canoga Place
- 3461 Canoga Place
- 3405 Canoga Place
- 3460 Canoga Place
- 3424 Canoga Place
- 3473 Canoga Place
- 3472 Canoga Place
- 3416 Canoga Place
- 3448 Canoga Place
- 3436 Canoga Place
- 3391 Canoga Place
- 1634 Dara St
- 3404 Canoga Place
- 1620 Dara St
- 1648 Dara St
- 3485 Canoga Place
- 3484 Canoga Place
- 3331 E Barca St
- 3343 E Barca St
- 3331 Barca St