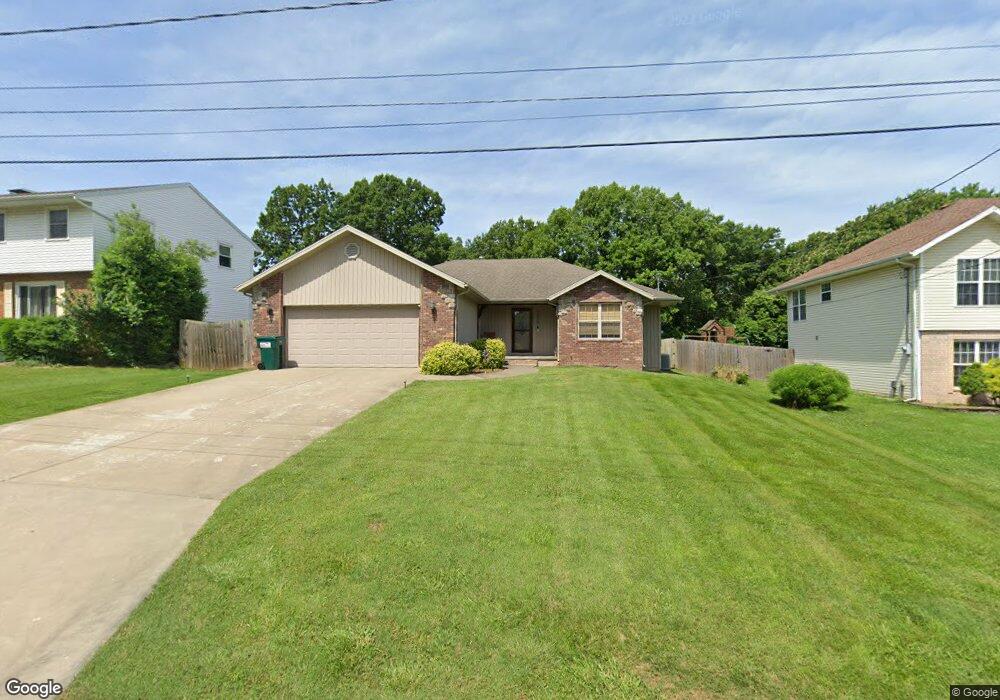
3439 N Marwin Ave Springfield, MO 65803
Estimated Value: $244,057 - $280,000
3
Beds
2
Baths
1,385
Sq Ft
$190/Sq Ft
Est. Value
About This Home
This home is located at 3439 N Marwin Ave, Springfield, MO 65803 and is currently estimated at $262,764, approximately $189 per square foot. 3439 N Marwin Ave is a home located in Greene County with nearby schools including Fremont Elementary School, Pleasant View K-8 School, and Hillcrest High School.
Ownership History
Date
Name
Owned For
Owner Type
Purchase Details
Closed on
Apr 8, 2024
Sold by
Doreen S Steward Vap Trust and Call Jo Ann
Bought by
Jo Ann Call Dynasty Trust and Call
Current Estimated Value
Purchase Details
Closed on
Mar 4, 2022
Sold by
Steward Doreen S
Bought by
Doreen S Steward Vap Trust
Purchase Details
Closed on
May 31, 2018
Sold by
Hall David W and Hall Stacey L
Bought by
Neal Jesse
Home Financials for this Owner
Home Financials are based on the most recent Mortgage that was taken out on this home.
Original Mortgage
$116,844
Interest Rate
4.62%
Mortgage Type
FHA
Purchase Details
Closed on
Sep 28, 2007
Sold by
Robison Byron E and Robison Barbara T
Bought by
Hall David W and Hall Stacey L
Home Financials for this Owner
Home Financials are based on the most recent Mortgage that was taken out on this home.
Original Mortgage
$27,200
Interest Rate
6.55%
Mortgage Type
Purchase Money Mortgage
Create a Home Valuation Report for This Property
The Home Valuation Report is an in-depth analysis detailing your home's value as well as a comparison with similar homes in the area
Purchase History
| Date | Buyer | Sale Price | Title Company |
|---|---|---|---|
| Jo Ann Call Dynasty Trust | -- | None Listed On Document | |
| Doreen S Steward Vap Trust | -- | None Listed On Document | |
| Neal Jesse | -- | Polk County Title Co | |
| Hall David W | -- | None Available |
Source: Public Records
Mortgage History
| Date | Status | Borrower | Loan Amount |
|---|---|---|---|
| Previous Owner | Neal Jesse | $116,844 | |
| Previous Owner | Hall David W | $27,200 |
Source: Public Records
Tax History
| Year | Tax Paid | Tax Assessment Tax Assessment Total Assessment is a certain percentage of the fair market value that is determined by local assessors to be the total taxable value of land and additions on the property. | Land | Improvement |
|---|---|---|---|---|
| 2025 | $2,010 | $37,160 | $8,320 | $28,840 |
| 2024 | $1,847 | $31,900 | $4,180 | $27,720 |
| 2023 | $1,837 | $31,900 | $4,180 | $27,720 |
| 2022 | $1,618 | $27,530 | $4,180 | $23,350 |
| 2021 | $1,547 | $27,530 | $4,180 | $23,350 |
| 2020 | $1,485 | $25,080 | $4,180 | $20,900 |
| 2019 | $1,443 | $25,080 | $4,180 | $20,900 |
| 2018 | $1,411 | $24,400 | $3,230 | $21,170 |
| 2017 | $1,398 | $24,400 | $3,230 | $21,170 |
| 2016 | $1,396 | $24,400 | $3,230 | $21,170 |
| 2015 | $1,386 | $24,400 | $3,230 | $21,170 |
| 2014 | $1,385 | $24,400 | $3,230 | $21,170 |
Source: Public Records
Map
Nearby Homes
- 3424 N Darwin Ave
- 1923 E Valley Water Mill Rd
- 3815 N Mill Ridge Ave
- 4260 N State Highway H
- 3839 N Stewart Ave
- 3333 N Delaware Ave
- 3975 N Stewart Ave
- 2393 E Valley Water Mill Rd
- 1502 E McClernon St
- 1362 E Bonaire Ct
- 1414 E Smith St
- 3749 N Pickwick Ave
- 3753 N Pickwick Ave
- 3107 N Neergard Ave
- 1339 E McClernon St
- 1475 E Burntwood St
- 3734 N Rogers Ave
- 1255 E Bonaire Dr
- 1349 E Stoneridge St
- 3005 N Fremont Ave
- 3445 N Marwin Ave
- 3431 N Marwin Ave
- 3423 N Marwin Ave
- Lot 33 N Marwin Ave
- 3453 N Marwin Ave
- 2025 E Camorene St
- 2030 E Lon St
- 2031 E Camorene St
- 3503 N Marwin Ave
- 2014 E Camorene St
- 2025 E Lon St
- 2038 E Lon St
- 2039 E Camorene St
- 3511 N Marwin Ave
- 2028 E Camorene St
- 2039 E Lon St
- 2046 E Lon St
- 2047 E Camorene St
- 3517 N Marwin Ave
- 2024 E Ryan St
Your Personal Tour Guide
Ask me questions while you tour the home.