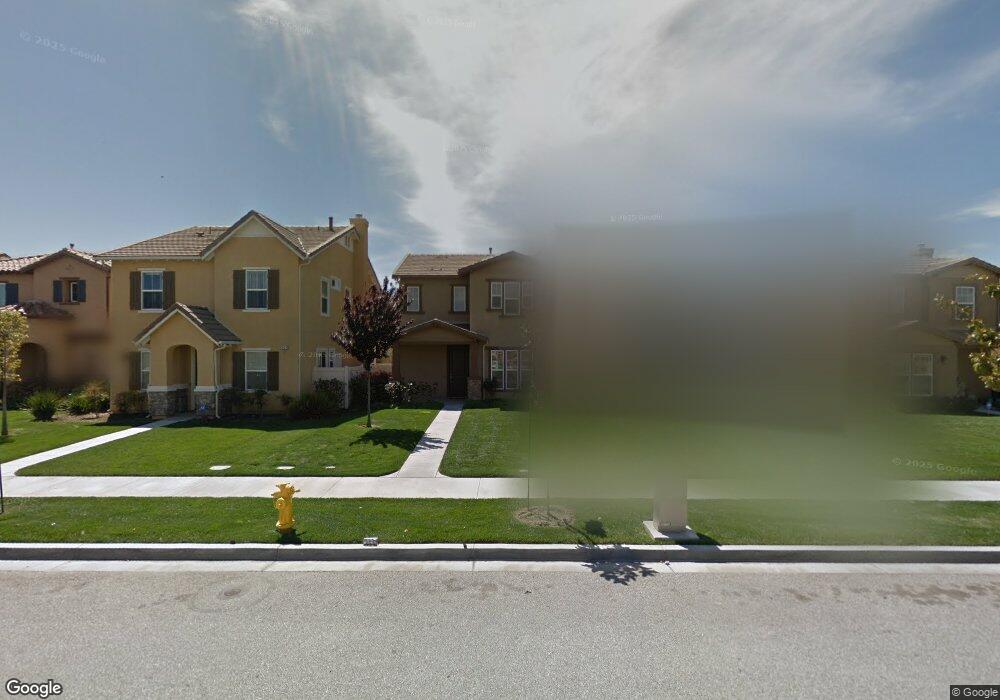
344 Lakeview Ct Oxnard, CA 93036
Town Center NeighborhoodEstimated Value: $825,000 - $931,000
4
Beds
3
Baths
2,021
Sq Ft
$424/Sq Ft
Est. Value
About This Home
This home is located at 344 Lakeview Ct, Oxnard, CA 93036 and is currently estimated at $856,938, approximately $424 per square foot. 344 Lakeview Ct is a home located in Ventura County with nearby schools including Rio Del Mar School, Rio Vista Middle School, and Rio Mesa High School.
Ownership History
Date
Name
Owned For
Owner Type
Purchase Details
Closed on
Jan 9, 2026
Sold by
Albalat Morece and Balat Mari
Bought by
Albalat Morece and Balat Mari
Current Estimated Value
Home Financials for this Owner
Home Financials are based on the most recent Mortgage that was taken out on this home.
Original Mortgage
$550,000
Outstanding Balance
$550,000
Interest Rate
6.19%
Mortgage Type
New Conventional
Estimated Equity
$306,938
Purchase Details
Closed on
Mar 28, 2022
Sold by
Belat and Janette
Bought by
Balat Morece and Balat Mari
Home Financials for this Owner
Home Financials are based on the most recent Mortgage that was taken out on this home.
Original Mortgage
$480,000
Interest Rate
7.63%
Mortgage Type
New Conventional
Purchase Details
Closed on
Aug 4, 2016
Sold by
Manwani Kalanwanti
Bought by
Belat Samir and Belat Janette
Home Financials for this Owner
Home Financials are based on the most recent Mortgage that was taken out on this home.
Original Mortgage
$359,900
Interest Rate
3.48%
Mortgage Type
New Conventional
Purchase Details
Closed on
Sep 6, 2011
Sold by
Kumary Sheela
Bought by
Manwani Kalanwanti
Purchase Details
Closed on
Sep 2, 2011
Sold by
Manwani Gopal
Bought by
Kumary Sheela
Purchase Details
Closed on
Aug 31, 2011
Sold by
Manwani Harry
Bought by
Manwani Kalanwanti
Purchase Details
Closed on
Mar 9, 2007
Sold by
Manwani Bharti
Bought by
Manwani Gopal
Home Financials for this Owner
Home Financials are based on the most recent Mortgage that was taken out on this home.
Original Mortgage
$427,240
Interest Rate
5.25%
Mortgage Type
Purchase Money Mortgage
Create a Home Valuation Report for This Property
The Home Valuation Report is an in-depth analysis detailing your home's value as well as a comparison with similar homes in the area
Home Values in the Area
Average Home Value in this Area
Purchase History
| Date | Buyer | Sale Price | Title Company |
|---|---|---|---|
| Albalat Morece | -- | California Title Company | |
| Balat Morece | $600,000 | Timios | |
| Belat Samir | $480,000 | Consumers Title Company | |
| Manwani Kalanwanti | -- | None Available | |
| Kumary Sheela | $275,000 | Ticor Title Company | |
| Manwani Kalanwanti | -- | None Available | |
| Kumary Sheela | -- | Ticor | |
| Manwani Gopal | -- | Commerce Title Company | |
| Manwani Gopal | $534,500 | Commerce |
Source: Public Records
Mortgage History
| Date | Status | Borrower | Loan Amount |
|---|---|---|---|
| Open | Albalat Morece | $550,000 | |
| Previous Owner | Balat Morece | $480,000 | |
| Previous Owner | Belat Samir | $359,900 | |
| Previous Owner | Manwani Gopal | $427,240 | |
| Previous Owner | Manwani Gopal | $106,810 |
Source: Public Records
Tax History
| Year | Tax Paid | Tax Assessment Tax Assessment Total Assessment is a certain percentage of the fair market value that is determined by local assessors to be the total taxable value of land and additions on the property. | Land | Improvement |
|---|---|---|---|---|
| 2025 | $14,654 | $779,987 | $507,258 | $272,729 |
| 2024 | $14,654 | $764,694 | $497,312 | $267,382 |
| 2023 | $13,795 | $749,700 | $487,560 | $262,140 |
| 2022 | $10,871 | $524,836 | $341,215 | $183,621 |
| 2021 | $10,765 | $514,546 | $334,525 | $180,021 |
| 2020 | $11,564 | $509,272 | $331,096 | $178,176 |
| 2019 | $11,302 | $499,287 | $324,604 | $174,683 |
| 2018 | $11,441 | $489,498 | $318,240 | $171,258 |
| 2017 | $11,285 | $479,900 | $312,000 | $167,900 |
| 2016 | $9,197 | $312,064 | $156,032 | $156,032 |
| 2015 | $9,160 | $307,380 | $153,690 | $153,690 |
| 2014 | $8,892 | $301,362 | $150,681 | $150,681 |
Source: Public Records
Map
Nearby Homes
- 3143 Moss Landing Blvd
- 3040 Moss Landing Blvd
- 3005 Roia Ln
- 3155 London Ln
- 3016 Moonlight Park Ave
- 3108 N Oxnard Blvd
- 3269 Moss Landing Blvd Unit 4
- 511 Nile River Dr
- 613 Flathead River St
- 3134 Lisbon Ln
- 629 Forest Park Blvd
- 3014 N Oxnard Blvd
- 316 Elk River Place
- 3100 N Ventura Rd
- 669 Seine River Way
- 2715 Smokey Mountain Dr
- 2810 Wagon Wheel Rd Unit 304
- 2820 Wagon Wheel Rd Unit 302
- 2820 Wagon Wheel Rd Unit 403
- 2870 Wagon Wheel Rd Unit 203
- 346 Lakeview Ct
- 342 Lakeview Ct
- 348 Lakeview Ct
- 340 Lakeview Ct
- 350 Lakeview Ct
- 338 Lakeview Ct
- 347 Kiawah River Dr
- 349 Kiawah River Dr
- 352 Lakeview Ct
- 336 Lakeview Ct
- 343 Kiawah River Dr
- 351 Kiawah River Dr
- 341 Kiawah River Dr
- 341 Kiawah Dr Unit 26
- 353 Kiawah River Dr
- 339 Kiawah River Dr
- 355 Kiawah River Dr
- 337 Kiawah River Dr Unit B
- 337 Kiawah River Dr
- 354 Lakeview Ct
Your Personal Tour Guide
Ask me questions while you tour the home.