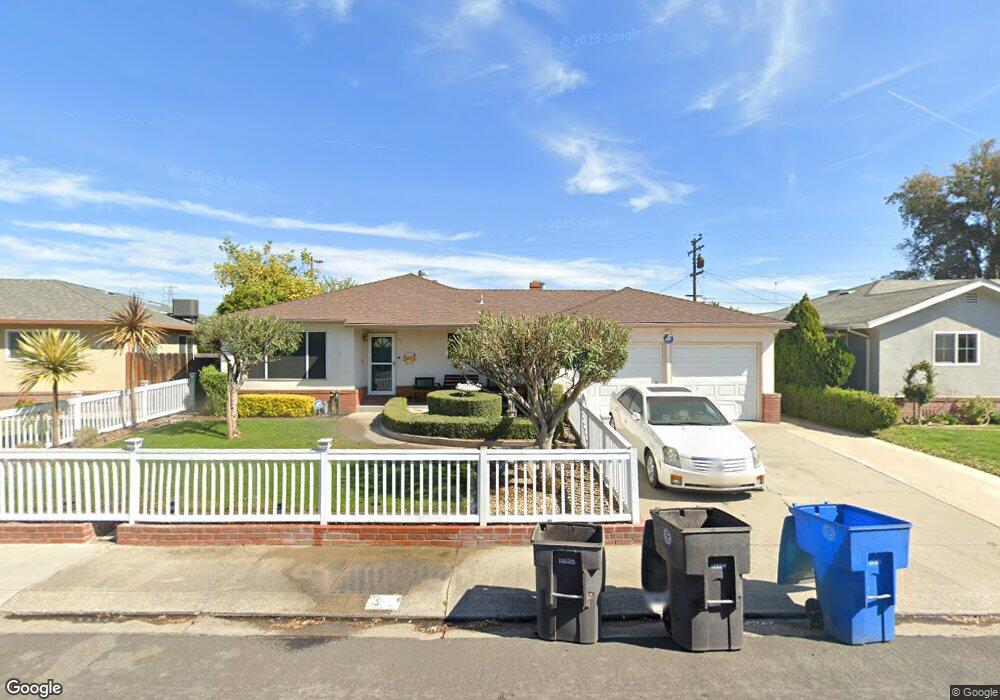
344 N Fremont St Manteca, CA 95336
Downtown Manteca NeighborhoodEstimated Value: $418,000 - $495,000
3
Beds
2
Baths
1,494
Sq Ft
$312/Sq Ft
Est. Value
About This Home
This home is located at 344 N Fremont St, Manteca, CA 95336 and is currently estimated at $466,060, approximately $311 per square foot. 344 N Fremont St is a home located in San Joaquin County with nearby schools including Shasta Elementary School, Manteca High School, and St. Anthony's Catholic School.
Ownership History
Date
Name
Owned For
Owner Type
Purchase Details
Closed on
Jan 23, 2006
Sold by
Reyes Jesse M
Bought by
Carbajal Richard and Carbajal Donna R
Current Estimated Value
Home Financials for this Owner
Home Financials are based on the most recent Mortgage that was taken out on this home.
Original Mortgage
$304,000
Outstanding Balance
$164,230
Interest Rate
5.62%
Mortgage Type
Purchase Money Mortgage
Estimated Equity
$301,830
Purchase Details
Closed on
Jul 28, 1997
Sold by
Bateman Kevin Leon and Bateman Michylle
Bought by
Reyes Jesse M and Reyes Esther E
Home Financials for this Owner
Home Financials are based on the most recent Mortgage that was taken out on this home.
Original Mortgage
$128,630
Interest Rate
7.58%
Mortgage Type
FHA
Create a Home Valuation Report for This Property
The Home Valuation Report is an in-depth analysis detailing your home's value as well as a comparison with similar homes in the area
Home Values in the Area
Average Home Value in this Area
Purchase History
| Date | Buyer | Sale Price | Title Company |
|---|---|---|---|
| Carbajal Richard | $380,000 | Placer Title Company | |
| Reyes Jesse M | $130,000 | Central Valley Title Company |
Source: Public Records
Mortgage History
| Date | Status | Borrower | Loan Amount |
|---|---|---|---|
| Open | Carbajal Richard | $304,000 | |
| Previous Owner | Reyes Jesse M | $128,630 |
Source: Public Records
Tax History Compared to Growth
Tax History
| Year | Tax Paid | Tax Assessment Tax Assessment Total Assessment is a certain percentage of the fair market value that is determined by local assessors to be the total taxable value of land and additions on the property. | Land | Improvement |
|---|---|---|---|---|
| 2025 | $2,226 | $205,964 | $63,863 | $142,101 |
| 2024 | $2,162 | $201,926 | $62,611 | $139,315 |
| 2023 | $2,134 | $197,968 | $61,384 | $136,584 |
| 2022 | $2,101 | $194,087 | $60,181 | $133,906 |
| 2021 | $2,077 | $190,282 | $59,001 | $131,281 |
| 2020 | $1,992 | $188,332 | $58,397 | $129,935 |
| 2019 | $1,965 | $184,640 | $57,252 | $127,388 |
| 2018 | $1,937 | $181,021 | $56,130 | $124,891 |
| 2017 | $1,908 | $177,473 | $55,030 | $122,443 |
| 2016 | $1,860 | $173,994 | $53,952 | $120,042 |
| 2015 | $1,848 | $171,380 | $53,141 | $118,239 |
| 2014 | $1,728 | $168,023 | $52,100 | $115,923 |
Source: Public Records
Map
Nearby Homes
- 232 N Sherman Ave
- 521 Emperor Ct
- 311 N Lincoln Ave
- 931 E North St
- 215 N Lincoln Ave
- 160 N Powers Ave
- 1110 Aldwina Ln
- 1129 E Alameda St
- 116 W Yosemite Ave
- 1065 Bristow St
- 200 Dan St
- 338 Cottage Ave
- 231 Poplar Ave
- 1003 Alfonso Ln
- 427 Argonaut St
- 1015 Lucio St
- 555 Moffat Blvd Unit 37
- 555 Moffat Blvd Unit 14
- 555 Moffat Blvd Unit 49
- 406 Elm Ave
- 340 N Fremont St
- 610 Sierra St
- 355 Harding Ave
- 359 Harding Ave
- 336 N Fremont St
- 349 Harding Ave
- 620 Sierra St
- 525 Sutter St
- 345 Harding Ave
- 332 N Fremont St
- 409 N Fremont St
- 605 Sierra St
- 339 Harding Ave
- 615 Sierra St
- 328 N Fremont St
- 352 Harding Ave
- 625 Sierra St
- 348 Harding Ave
- 356 Harding Ave
- 523 Sutter St