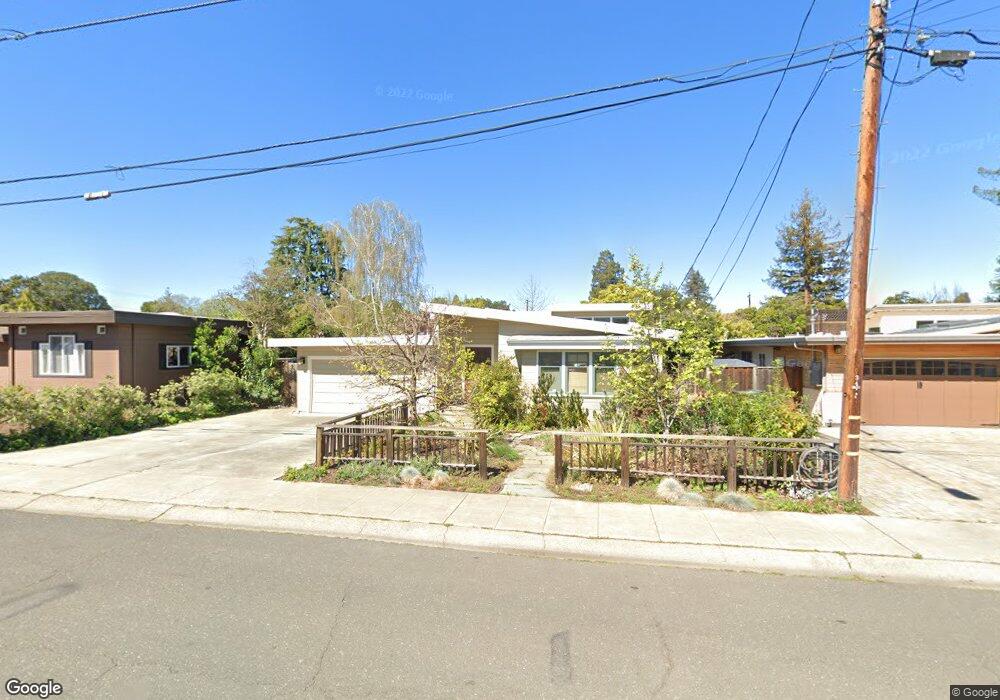
344 Whitclem Dr Palo Alto, CA 94306
Charleston Meadows NeighborhoodEstimated Value: $2,880,000 - $3,173,000
3
Beds
2
Baths
1,101
Sq Ft
$2,764/Sq Ft
Est. Value
About This Home
This home is located at 344 Whitclem Dr, Palo Alto, CA 94306 and is currently estimated at $3,042,680, approximately $2,763 per square foot. 344 Whitclem Dr is a home located in Santa Clara County with nearby schools including Juana Briones Elementary School, Ellen Fletcher Middle, and Henry M. Gunn High School.
Ownership History
Date
Name
Owned For
Owner Type
Purchase Details
Closed on
Sep 28, 2013
Sold by
Hempstead Anna J and Hempstead James H
Bought by
Hempstead James H and Hempstead Anna J
Current Estimated Value
Purchase Details
Closed on
Dec 18, 2002
Sold by
Hempstead Anna J and Hempstead James H
Bought by
Hempstead James H and Hempstead Anna J
Home Financials for this Owner
Home Financials are based on the most recent Mortgage that was taken out on this home.
Original Mortgage
$342,000
Interest Rate
5.86%
Purchase Details
Closed on
Dec 12, 1997
Sold by
Truchan E Gladys
Bought by
Hempstead James H and Hempstead Ann J
Home Financials for this Owner
Home Financials are based on the most recent Mortgage that was taken out on this home.
Original Mortgage
$320,000
Interest Rate
7.23%
Purchase Details
Closed on
Jan 10, 1995
Sold by
Birkel Martin and Birkel Josephine
Bought by
Birkel Martin O and Birkel Josephine
Create a Home Valuation Report for This Property
The Home Valuation Report is an in-depth analysis detailing your home's value as well as a comparison with similar homes in the area
Home Values in the Area
Average Home Value in this Area
Purchase History
| Date | Buyer | Sale Price | Title Company |
|---|---|---|---|
| Hempstead James H | -- | None Available | |
| Hempstead James H | -- | First American Title Company | |
| Hempstead James H | $400,000 | Old Republic Title Company | |
| Birkel Martin O | -- | -- |
Source: Public Records
Mortgage History
| Date | Status | Borrower | Loan Amount |
|---|---|---|---|
| Closed | Hempstead James H | $342,000 | |
| Previous Owner | Hempstead James H | $320,000 | |
| Closed | Hempstead James H | $40,000 |
Source: Public Records
Tax History Compared to Growth
Tax History
| Year | Tax Paid | Tax Assessment Tax Assessment Total Assessment is a certain percentage of the fair market value that is determined by local assessors to be the total taxable value of land and additions on the property. | Land | Improvement |
|---|---|---|---|---|
| 2025 | $9,992 | $779,385 | $479,020 | $300,365 |
| 2024 | $9,992 | $764,104 | $469,628 | $294,476 |
| 2023 | $9,841 | $749,122 | $460,420 | $288,702 |
| 2022 | $9,721 | $734,435 | $451,393 | $283,042 |
| 2021 | $9,529 | $720,036 | $442,543 | $277,493 |
| 2020 | $9,345 | $712,654 | $438,006 | $274,648 |
| 2019 | $9,238 | $698,681 | $429,418 | $269,263 |
| 2018 | $9,000 | $684,983 | $420,999 | $263,984 |
| 2017 | $8,841 | $671,553 | $412,745 | $258,808 |
| 2016 | $8,605 | $658,386 | $404,652 | $253,734 |
| 2015 | $8,516 | $648,497 | $398,574 | $249,923 |
| 2014 | $8,274 | $635,795 | $390,767 | $245,028 |
Source: Public Records
Map
Nearby Homes
- 278 Monroe Dr Unit 35
- 4206 Rickeys Way Unit C
- 4225 Park Blvd
- 342 Carolina Ln
- 4173 El Camino Real Unit 1
- 4250 El Camino Real Unit B120
- 26 Roosevelt Cir
- 181 Del Medio Ave Unit 307
- 3941 Duncan Place
- 4132 Thain Way
- 579 Glenbrook Dr
- 4287 Pomona Ave
- 2255 Showers Dr Unit 152
- 4198 Cherry Oaks Place
- 3428 Alma Village Cir
- 645 Maybell Ave Unit A
- 418 Ferne Ave
- 717 Los Robles Ave
- 3888 Magnolia Dr
- 444 San Antonio Rd Unit 1A
- 354 Whitclem Dr
- 324 Whitclem Dr
- 341 Edlee Ave
- 312 Whitclem Dr
- 374 Whitclem Dr
- 321 Edlee Ave
- 351 Edlee Ave
- 311 Edlee Ave
- 343 Whitclem Dr
- 353 Whitclem Place
- 361 Edlee Ave
- 384 Whitclem Dr
- 302 Whitclem Dr
- 321 Whitclem Dr
- 301 Edlee Ave
- 311 Whitclem Dr
- 371 Edlee Ave
- 369 Whitclem Dr
- 292 Whitclem Dr
- 386 Whitclem Dr