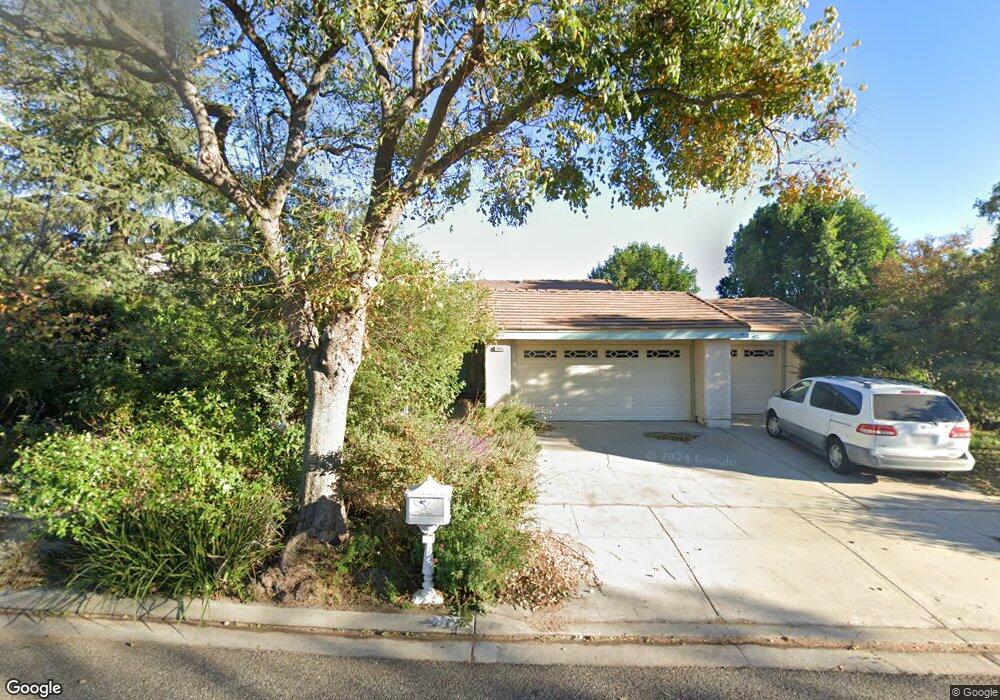
3440 Leora St Simi Valley, CA 93063
Central Simi Valley NeighborhoodEstimated Value: $937,000 - $1,007,000
3
Beds
2
Baths
1,915
Sq Ft
$511/Sq Ft
Est. Value
About This Home
This home is located at 3440 Leora St, Simi Valley, CA 93063 and is currently estimated at $979,208, approximately $511 per square foot. 3440 Leora St is a home located in Ventura County with nearby schools including Township Elementary School, Valley View Middle School, and Simi Valley High School.
Ownership History
Date
Name
Owned For
Owner Type
Purchase Details
Closed on
Dec 18, 2012
Sold by
Hansen Raymond R and Hansen Susan M
Bought by
Hansen Raymond R and Hansen Susan M
Current Estimated Value
Purchase Details
Closed on
Apr 23, 2008
Sold by
Bystrom Brett and Bystrom Amy
Bought by
Hansen Raymond R and Hansen Susan M
Home Financials for this Owner
Home Financials are based on the most recent Mortgage that was taken out on this home.
Original Mortgage
$27,450
Interest Rate
5.6%
Mortgage Type
Unknown
Purchase Details
Closed on
Dec 3, 2004
Sold by
Kasim Hisham M and Radhayrapetian Juliet
Bought by
Bystrom Brett and Brystrom Amy
Home Financials for this Owner
Home Financials are based on the most recent Mortgage that was taken out on this home.
Original Mortgage
$464,250
Interest Rate
3.75%
Mortgage Type
Purchase Money Mortgage
Create a Home Valuation Report for This Property
The Home Valuation Report is an in-depth analysis detailing your home's value as well as a comparison with similar homes in the area
Home Values in the Area
Average Home Value in this Area
Purchase History
| Date | Buyer | Sale Price | Title Company |
|---|---|---|---|
| Hansen Raymond R | -- | None Available | |
| Hansen Raymond R | $549,000 | Ticor Title Company Wlv | |
| Bystrom Brett | $619,000 | Advantage Title |
Source: Public Records
Mortgage History
| Date | Status | Borrower | Loan Amount |
|---|---|---|---|
| Closed | Hansen Raymond R | $27,450 | |
| Previous Owner | Hansen Raymond R | $411,750 | |
| Previous Owner | Bystrom Brett | $464,250 | |
| Closed | Bystrom Brett | $123,800 |
Source: Public Records
Tax History
| Year | Tax Paid | Tax Assessment Tax Assessment Total Assessment is a certain percentage of the fair market value that is determined by local assessors to be the total taxable value of land and additions on the property. | Land | Improvement |
|---|---|---|---|---|
| 2025 | $8,768 | $721,103 | $468,920 | $252,183 |
| 2024 | $8,768 | $706,964 | $459,725 | $247,239 |
| 2023 | $8,259 | $693,102 | $450,710 | $242,392 |
| 2022 | $8,248 | $679,512 | $441,872 | $237,640 |
| 2021 | $8,209 | $666,189 | $433,208 | $232,981 |
| 2020 | $8,055 | $659,360 | $428,767 | $230,593 |
| 2019 | $7,702 | $646,432 | $420,360 | $226,072 |
| 2018 | $7,652 | $633,758 | $412,118 | $221,640 |
| 2017 | $7,496 | $621,333 | $404,038 | $217,295 |
| 2016 | $7,174 | $609,151 | $396,116 | $213,035 |
| 2015 | $7,038 | $600,003 | $390,167 | $209,836 |
| 2014 | $6,540 | $550,000 | $358,000 | $192,000 |
Source: Public Records
Map
Nearby Homes
- 6505 Canyon Oaks Dr
- 3307 Cole Ave
- 3265 Sheri Dr
- 3309 Los Nogales Rd
- 3067 Harrison Ln
- 3445 Highwood Ct Unit 128
- 3562 Quincy Ave
- 2696 Santa Ynez Ave
- 3417 Highwood Ct Unit 148
- 3010 Tallahassee Ln
- 3049 Tallahassee Ln
- 2832 Thicket Place
- 3474 Highwood Ct Unit 80
- 3434 Highwood Ct Unit 183
- 3458 Highwood Ct Unit 198
- 3598 Scofield Ave
- 2916 Esperanza Way Unit F
- 3585 Woodhaven St
- 3550 Woodhaven St
- 2671 Coral Gum Ln
Your Personal Tour Guide
Ask me questions while you tour the home.