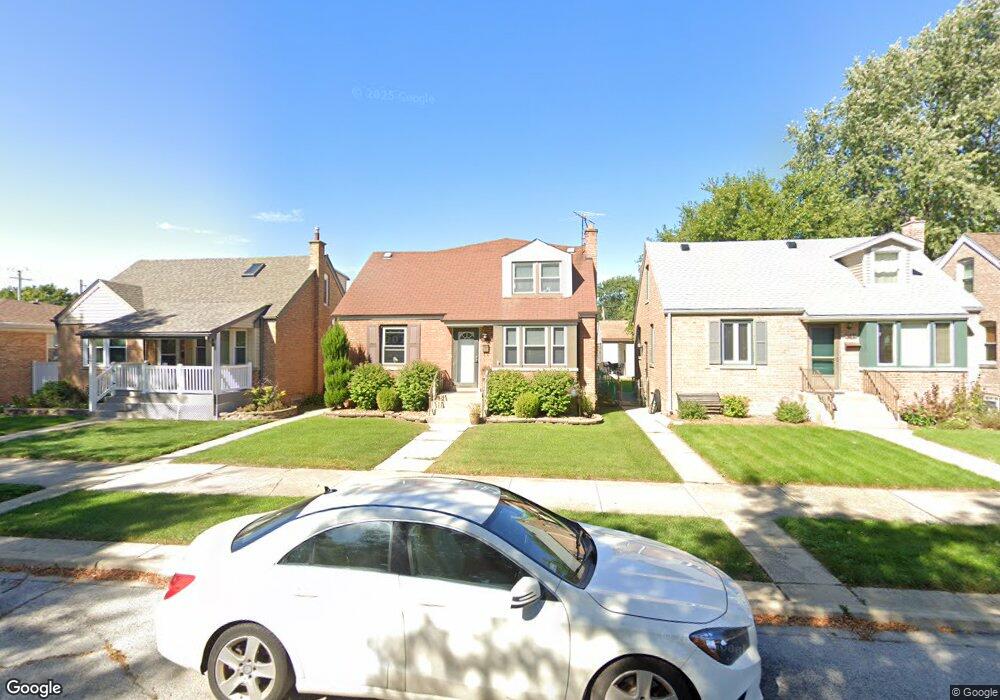
3440 W 115th Place Chicago, IL 60655
Mount Greenwood NeighborhoodEstimated Value: $343,000 - $429,000
3
Beds
3
Baths
2,128
Sq Ft
$183/Sq Ft
Est. Value
About This Home
This home is located at 3440 W 115th Place, Chicago, IL 60655 and is currently estimated at $389,113, approximately $182 per square foot. 3440 W 115th Place is a home located in Cook County with nearby schools including George F Cassell Elementary School, Morgan Park High School, and St. Christina School.
Ownership History
Date
Name
Owned For
Owner Type
Purchase Details
Closed on
Oct 17, 2014
Sold by
Killen Brian P and Killen Melania
Bought by
Killen Brian P
Current Estimated Value
Purchase Details
Closed on
Nov 7, 2005
Sold by
Killen Brian and Killen Kevin
Bought by
Killen Brian P and Guansing Melania
Home Financials for this Owner
Home Financials are based on the most recent Mortgage that was taken out on this home.
Original Mortgage
$192,000
Outstanding Balance
$105,200
Interest Rate
6.04%
Mortgage Type
New Conventional
Estimated Equity
$283,913
Purchase Details
Closed on
Aug 6, 2004
Sold by
Abels Christine
Bought by
Killen Brian and Killne Kevin
Home Financials for this Owner
Home Financials are based on the most recent Mortgage that was taken out on this home.
Original Mortgage
$189,900
Interest Rate
5.93%
Mortgage Type
Unknown
Purchase Details
Closed on
May 9, 2001
Sold by
Abels Kenneth L
Bought by
Abels Christine
Create a Home Valuation Report for This Property
The Home Valuation Report is an in-depth analysis detailing your home's value as well as a comparison with similar homes in the area
Home Values in the Area
Average Home Value in this Area
Purchase History
| Date | Buyer | Sale Price | Title Company |
|---|---|---|---|
| Killen Brian P | -- | Indecomm Global Services | |
| Killen Brian P | -- | Ticor Title | |
| Killen Brian | $211,000 | Ticor Title | |
| Abels Christine | -- | -- |
Source: Public Records
Mortgage History
| Date | Status | Borrower | Loan Amount |
|---|---|---|---|
| Open | Killen Brian P | $192,000 | |
| Previous Owner | Killen Brian | $189,900 |
Source: Public Records
Tax History Compared to Growth
Tax History
| Year | Tax Paid | Tax Assessment Tax Assessment Total Assessment is a certain percentage of the fair market value that is determined by local assessors to be the total taxable value of land and additions on the property. | Land | Improvement |
|---|---|---|---|---|
| 2024 | $5,810 | $40,001 | $5,953 | $34,048 |
| 2023 | $6,102 | $30,787 | $4,762 | $26,025 |
| 2022 | $6,102 | $33,000 | $4,762 | $28,238 |
| 2021 | $5,983 | $33,000 | $4,762 | $28,238 |
| 2020 | $5,545 | $27,934 | $4,523 | $23,411 |
| 2019 | $5,493 | $30,697 | $4,523 | $26,174 |
| 2018 | $5,399 | $30,697 | $4,523 | $26,174 |
| 2017 | $4,427 | $23,893 | $4,047 | $19,846 |
| 2016 | $4,296 | $23,893 | $4,047 | $19,846 |
| 2015 | $3,907 | $23,893 | $4,047 | $19,846 |
| 2014 | $3,168 | $19,603 | $3,809 | $15,794 |
| 2013 | $3,094 | $19,603 | $3,809 | $15,794 |
Source: Public Records
Map
Nearby Homes
- 3435 W 115th St
- 3350 W 114th St
- 11325 S Homan Ave
- 3723 W 115th Place
- 3180 W Meadow Lane Dr Unit 43
- 3176 W Meadow Lane Dr Unit 40
- 11208 S Christiana Ave
- 3171 W 115th St Unit 1N
- 11202 S Christiana Ave
- 11160 S Christiana Ave
- 11709 S Kedzie Ave
- 3125 W 114th St
- 11809 S Millard Ave
- 11157 S Spaulding Ave
- 11712 S Troy Dr
- 3836 W 115th Place
- 11750 S Homan Ave Unit J
- 11750 S Homan Ave Unit 98
- 3820 W 117th St
- 3125 W Whipple Dr
- 3436 W 115th Place
- 3444 W 115th Place
- 3432 W 115th Place
- 3430 W 115th Place
- 3450 W 115th Place
- 3450 W 115th Place
- 3450 W 115th Place
- 3441 W 115th St
- 3445 W 115th St
- 3439 W 115th St
- 3456 W 115th Place
- 3426 W 115th Place
- 3447 W 115th St
- 3433 W 115th St
- 3451 W 115th St
- 3458 W 115th Place
- 3431 W 115th St
- 3422 W 115th Place
- 3453 W 115th St
- 3429 W 115th St