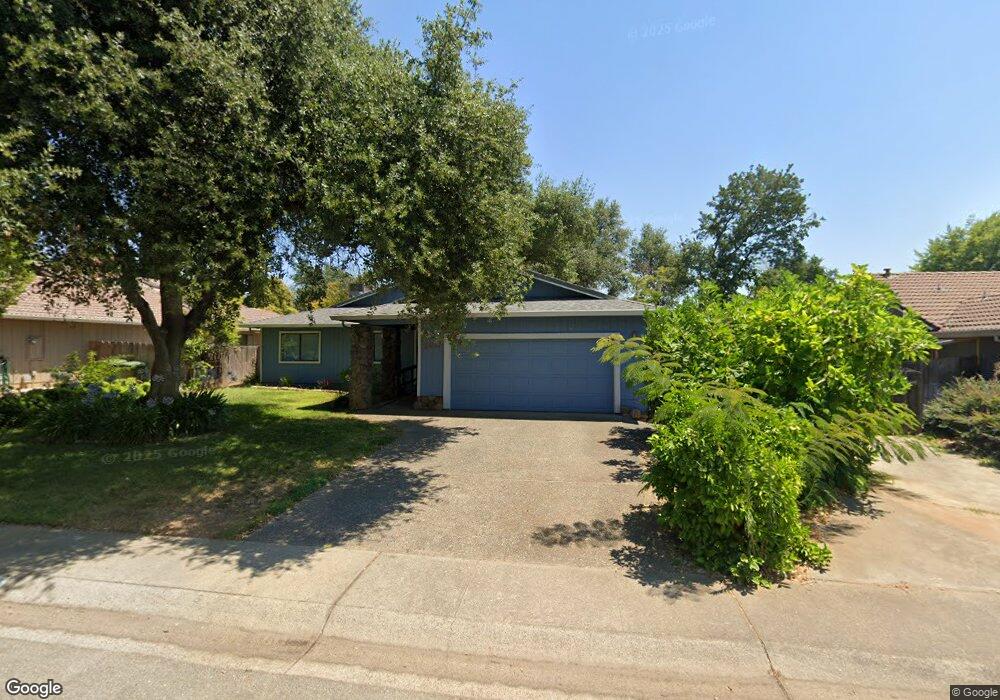
3443 Somerset Ave Unit 1 Redding, CA 96002
Oak Haven NeighborhoodEstimated Value: $340,000 - $370,000
3
Beds
2
Baths
1,470
Sq Ft
$244/Sq Ft
Est. Value
About This Home
This home is located at 3443 Somerset Ave Unit 1, Redding, CA 96002 and is currently estimated at $358,825, approximately $244 per square foot. 3443 Somerset Ave Unit 1 is a home located in Shasta County with nearby schools including Alta Mesa Elementary School, Parsons Junior High School, and Enterprise High School.
Ownership History
Date
Name
Owned For
Owner Type
Purchase Details
Closed on
Jun 17, 2025
Sold by
Judith A Roberts 2023 Trust and Roberts Judith A
Bought by
Mccullough Kimberly Ann
Current Estimated Value
Purchase Details
Closed on
Jan 25, 2023
Sold by
Roberts Judith A
Bought by
Judith A Roberts 2023 Trust
Purchase Details
Closed on
Feb 13, 2015
Sold by
Reeves Debbie
Bought by
Roberts John K and Roberts Judith A
Home Financials for this Owner
Home Financials are based on the most recent Mortgage that was taken out on this home.
Original Mortgage
$204,000
Interest Rate
3.66%
Mortgage Type
VA
Purchase Details
Closed on
Dec 27, 2000
Sold by
Andrews Linda A
Bought by
Michelizzi Anthony
Purchase Details
Closed on
Oct 13, 1999
Sold by
Sue Pardee Lynda
Bought by
Andrews Linda A
Create a Home Valuation Report for This Property
The Home Valuation Report is an in-depth analysis detailing your home's value as well as a comparison with similar homes in the area
Home Values in the Area
Average Home Value in this Area
Purchase History
| Date | Buyer | Sale Price | Title Company |
|---|---|---|---|
| Mccullough Kimberly Ann | $355,000 | Placer Title | |
| Judith A Roberts 2023 Trust | -- | -- | |
| Roberts John K | $204,000 | Placer Title Company | |
| Michelizzi Anthony | $122,000 | Fidelity National Title Co | |
| Andrews Linda A | $110,000 | Redding Title Company |
Source: Public Records
Mortgage History
| Date | Status | Borrower | Loan Amount |
|---|---|---|---|
| Previous Owner | Roberts John K | $204,000 |
Source: Public Records
Tax History
| Year | Tax Paid | Tax Assessment Tax Assessment Total Assessment is a certain percentage of the fair market value that is determined by local assessors to be the total taxable value of land and additions on the property. | Land | Improvement |
|---|---|---|---|---|
| 2025 | $2,594 | $245,167 | $54,078 | $191,089 |
| 2024 | $2,556 | $240,361 | $53,018 | $187,343 |
| 2023 | $2,556 | $235,649 | $51,979 | $183,670 |
| 2022 | $2,483 | $231,029 | $50,960 | $180,069 |
| 2021 | $2,397 | $226,500 | $49,961 | $176,539 |
| 2020 | $2,401 | $224,178 | $49,449 | $174,729 |
| 2019 | $2,442 | $219,783 | $48,480 | $171,303 |
| 2018 | $2,414 | $215,475 | $47,530 | $167,945 |
| 2017 | $2,456 | $211,251 | $46,599 | $164,652 |
| 2016 | $2,298 | $207,110 | $45,686 | $161,424 |
| 2015 | $1,904 | $169,967 | $35,891 | $134,076 |
| 2014 | $1,627 | $149,952 | $30,723 | $119,229 |
Source: Public Records
Map
Nearby Homes
- 3293 Middleton Ln
- 3360 Lawrence Rd
- 3466 Silverwood St
- 1397 Empress Ln
- 3528 Silverwood St
- 3283 Middleton Ln
- 3425 Silverwood St
- 3341 Timbercreek Dr
- 1513 Harpole Rd
- 1354 Harpole Rd
- 2068 Solar Way
- 3732 Mercury Dr
- 3178 Lawrence Rd
- 2976 West Way
- 1091 Del Sol Place
- 2906 Regal Ave
- 3985 Cirrus St
- 1075 Le Brun Ln
- 3072 Alta Mesa Dr
- 2893 Alfreda Way
- 3455 Somerset Ave
- 3425 Somerset Ave
- 1716 Soda Springs Cir
- 1748 Somerset Ct
- 3487 Somerset Ave
- 3450 Somerset Ave
- 3468 Somerset Ave
- 1728 Soda Springs Cir
- 3436 Somerset Ave
- 1760 Somerset Ct
- 3472 Somerset Ave
- 3414 Somerset Ave
- 3389 Somerset Ave
- 1711 Soda Springs Cir
- 1744 Soda Springs Cir
- 1783 Somerset Ct
- 3494 Somerset Ave
- 3513 Somerset Ave
- 3398 Somerset Ave
- 1723 Soda Springs Cir
Your Personal Tour Guide
Ask me questions while you tour the home.