Estimated Value: $140,000 - $157,000
2
Beds
2
Baths
1,160
Sq Ft
$128/Sq Ft
Est. Value
About This Home
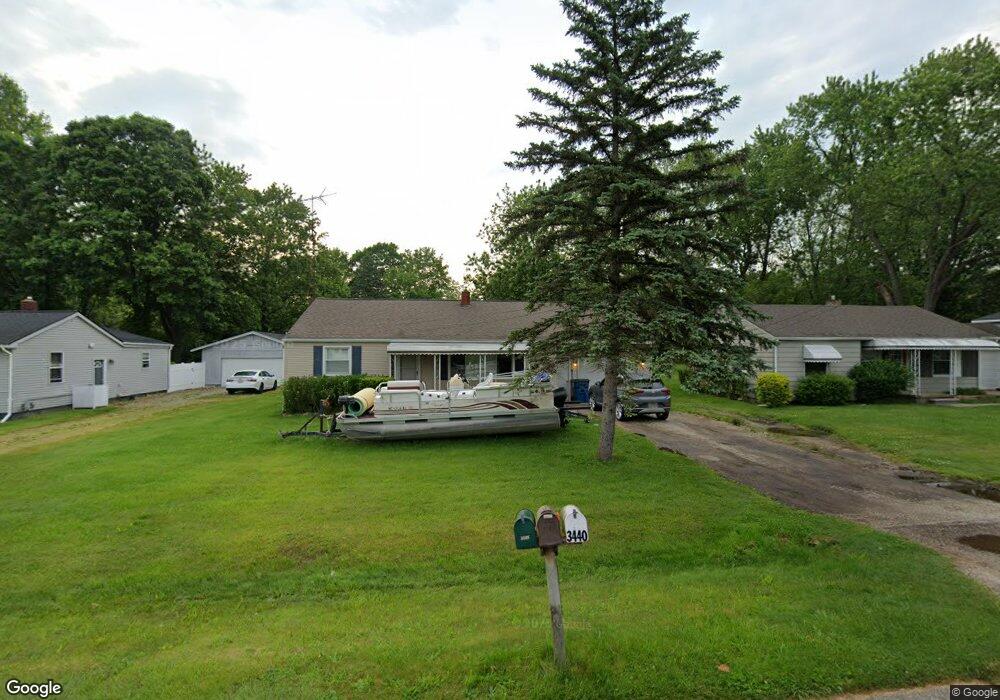
This home is located at 3446 Mills Acres St, Flint, MI 48506 and is currently estimated at $148,295, approximately $127 per square foot. 3446 Mills Acres St is a home located in Genesee County with nearby schools including Weston Elementary School, Kate Dowdall Elementary School, and Leota Fiedler Elementary School.
Ownership History
Date
Name
Owned For
Owner Type
Purchase Details
Closed on
Feb 22, 2010
Sold by
Brelinski Matthew D
Bought by
Federal Home Loan Mortgage Corp
Current Estimated Value
Purchase Details
Closed on
Jan 20, 2010
Sold by
Brelinski Matthew D
Bought by
Federal Home Loan Mortgage Corp
Purchase Details
Closed on
Dec 8, 2006
Sold by
Provost Steven L and Provost Katrina M
Bought by
Brelinski Matthew D
Purchase Details
Closed on
Oct 1, 2005
Sold by
Shiveley Daniel and Shiveley Melony
Bought by
Armstrong Richard
Purchase Details
Closed on
Jan 24, 2002
Sold by
Smothers Joann
Bought by
Provost Steven L and Boyer Katrina M
Purchase Details
Closed on
Nov 7, 2001
Sold by
Smother Joann and Estate Of Veronica I Malak
Bought by
Smothers Joann
Purchase Details
Closed on
Oct 18, 1999
Sold by
Malak Floyd C Veronica and Smothers Thomas R
Bought by
Malak Floyd C and Malak Veronica
Create a Home Valuation Report for This Property
The Home Valuation Report is an in-depth analysis detailing your home's value as well as a comparison with similar homes in the area
Home Values in the Area
Average Home Value in this Area
Purchase History
| Date | Buyer | Sale Price | Title Company |
|---|---|---|---|
| Federal Home Loan Mortgage Corp | $3,500 | Attorneys Title Agency Llc | |
| Federal Home Loan Mortgage Corp | $42,300 | None Available | |
| Brelinski Matthew D | $95,000 | Metropol | |
| Armstrong Richard | $100,500 | Cislo Title Co | |
| Provost Steven L | $85,000 | Sargents Title Company | |
| Smothers Joann | -- | -- | |
| Malak Floyd C | -- | Lawyers Title Insurance Corp |
Source: Public Records
Tax History Compared to Growth
Tax History
| Year | Tax Paid | Tax Assessment Tax Assessment Total Assessment is a certain percentage of the fair market value that is determined by local assessors to be the total taxable value of land and additions on the property. | Land | Improvement |
|---|---|---|---|---|
| 2025 | $1,358 | $64,100 | $0 | $0 |
| 2024 | $342 | $58,600 | $0 | $0 |
| 2023 | $327 | $53,500 | $0 | $0 |
| 2022 | $1,115 | $48,000 | $0 | $0 |
| 2021 | $1,106 | $43,200 | $0 | $0 |
| 2020 | $299 | $39,600 | $0 | $0 |
| 2019 | $294 | $34,800 | $0 | $0 |
| 2018 | $1,062 | $32,000 | $0 | $0 |
| 2017 | $1,019 | $31,100 | $0 | $0 |
| 2016 | $1,012 | $29,500 | $0 | $0 |
| 2015 | $813 | $26,300 | $0 | $0 |
| 2014 | $271 | $24,300 | $0 | $0 |
| 2012 | -- | $28,400 | $28,400 | $0 |
Source: Public Records
Map
Nearby Homes
- 3280 Lynne Ave
- 3247 Mills Acres St
- 3251 Lynne Ave
- 5467 Richfield Rd
- 5142 Berneda Dr
- 4062 N Belsay Rd
- 3389 Eastdale Dr
- 3201 Gehring Dr
- 3365 Eastdale Dr
- 3454 Eastdale Dr
- 3414 N Genesee Rd
- 6077 Crown Point
- 3294 Comer Dr
- 3413 Blue Lake Dr
- 5111 Paro Dr
- 4318 Tommy Armour Dr
- 0 Richfield Rd Unit 50166307
- 6298 Nightingale Dr
- 5068 Roberts Dr
- 4444 Maple Leaf Trail
- 3440 Mills Acres St
- 3452 Mills Acres St
- 3458 Mills Acres St
- 3432 Mills Acres St
- 3462 Mills Acres St
- 3426 Mills Acres St
- 3418 Mills Acres St
- 3468 Mills Acres St
- 3474 Mills Acres St
- 3412 Mills Acres St
- 3445 Mills Acres St
- 3439 Mills Acres St
- 3449 Mills Acres St
- 3467 Mills Acres St
- 3433 Mills Acres St
- 3455 Mills Acres St
- 3406 Mills Acres St
- 3480 Mills Acres St
- 3425 Mills Acres St
- 3461 Mills Acres St