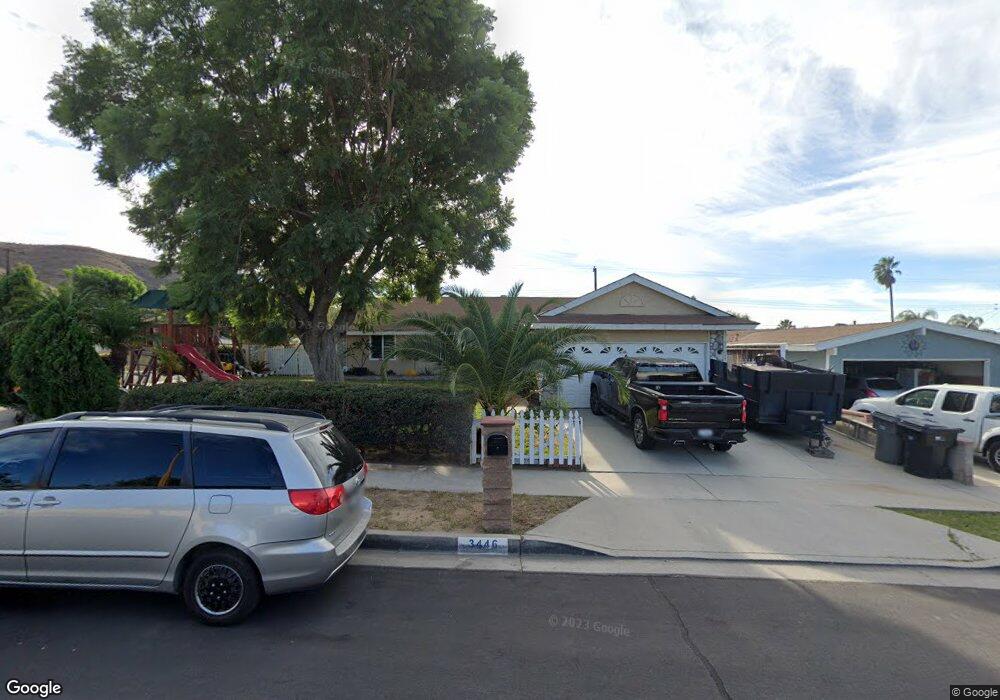
3446 Windsong St Corona, CA 92879
Estimated Value: $555,000 - $662,000
4
Beds
2
Baths
1,230
Sq Ft
$484/Sq Ft
Est. Value
About This Home
This home is located at 3446 Windsong St, Corona, CA 92879 and is currently estimated at $595,429, approximately $484 per square foot. 3446 Windsong St is a home located in Riverside County with nearby schools including Home Gardens Academy, Citrus Hills Intermediate School, and Santiago High School.
Ownership History
Date
Name
Owned For
Owner Type
Purchase Details
Closed on
Nov 8, 2017
Sold by
Morales Jose F and Morales Bertha A
Bought by
Morales Jose F
Current Estimated Value
Home Financials for this Owner
Home Financials are based on the most recent Mortgage that was taken out on this home.
Original Mortgage
$297,110
Outstanding Balance
$251,548
Interest Rate
4.25%
Mortgage Type
FHA
Estimated Equity
$343,881
Purchase Details
Closed on
Mar 14, 2003
Sold by
Arellano Jose
Bought by
Morales Jose F and Morales Bertha A
Home Financials for this Owner
Home Financials are based on the most recent Mortgage that was taken out on this home.
Original Mortgage
$220,675
Interest Rate
5.84%
Purchase Details
Closed on
Aug 5, 1999
Sold by
Alvarado Juan M and Alvarado Esther Soto
Bought by
Arellano Jose
Home Financials for this Owner
Home Financials are based on the most recent Mortgage that was taken out on this home.
Original Mortgage
$124,200
Interest Rate
7.77%
Create a Home Valuation Report for This Property
The Home Valuation Report is an in-depth analysis detailing your home's value as well as a comparison with similar homes in the area
Home Values in the Area
Average Home Value in this Area
Purchase History
We collect this data history from publicly available records. To have your information removed, we recommend requesting removal directly through your county’s website.
| Date | Buyer | Sale Price | Title Company |
|---|---|---|---|
| Morales Jose F | -- | Western Resources Title Comp | |
| Morales Jose F | $232,000 | Fidelity National Title Co | |
| Arellano Jose | $138,000 | Stewart Title |
Source: Public Records
Mortgage History
We collect this data history from publicly available records. To have your information removed, we recommend requesting removal directly through your county’s website.
| Date | Status | Borrower | Loan Amount |
|---|---|---|---|
| Open | Morales Jose F | $297,110 | |
| Previous Owner | Morales Jose F | $220,675 | |
| Previous Owner | Arellano Jose | $124,200 |
Source: Public Records
Tax History
| Year | Tax Paid | Tax Assessment Tax Assessment Total Assessment is a certain percentage of the fair market value that is determined by local assessors to be the total taxable value of land and additions on the property. | Land | Improvement |
|---|---|---|---|---|
| 2025 | $3,779 | $340,323 | $79,640 | $260,683 |
| 2023 | $3,779 | $327,110 | $76,549 | $250,561 |
| 2022 | $3,927 | $320,698 | $75,049 | $245,649 |
| 2021 | $3,586 | $314,411 | $73,578 | $240,833 |
| 2020 | $3,546 | $311,188 | $72,824 | $238,364 |
| 2019 | $3,464 | $305,088 | $71,397 | $233,691 |
| 2018 | $3,386 | $299,107 | $69,998 | $229,109 |
| 2017 | $3,302 | $293,243 | $68,626 | $224,617 |
| 2016 | $3,271 | $287,494 | $67,281 | $220,213 |
| 2015 | $3,199 | $283,177 | $66,271 | $216,906 |
| 2014 | $2,759 | $248,000 | $58,000 | $190,000 |
Source: Public Records
Map
Nearby Homes
- 13365 March Way
- 3491 Crownsworth St
- 3638 Candlewood St
- 13077 April Dr
- 13653 Magnolia Ave
- 13006 August Cir
- 3682 N Pole Ln
- 3350 May Ct
- 13381 Magnolia Ave Unit 124
- 13381 Magnolia Ave
- 3707 Calle Curacso
- 2324 Fan Palm Dr
- 3827 Grant St Unit 49
- 2354 Fan Palm Dr
- 3772 Camino Tobago
- 161 Breezewood St
- 3447 Yuba Cir
- 777 S Temescal St Unit 88
- 777 S Temescal St Unit 127
- 777 S Temescal St Unit 69
- 3456 Windsong St
- 3426 Windsong St
- 3465 Andover St
- 3466 Windsong St
- 3473 Andover St
- 3449 Andover St
- 3481 Andover St
- 3416 Windsong St
- 3437 Windsong St
- 3457 Windsong St
- 3476 Windsong St
- 3427 Windsong St
- 3441 Andover St
- 3467 Windsong St
- 3489 Andover St
- 3417 Windsong St
- 3486 Windsong St
- 3477 Windsong St
- 3425 Andover St
- 3406 Windsong St
Your Personal Tour Guide
Ask me questions while you tour the home.