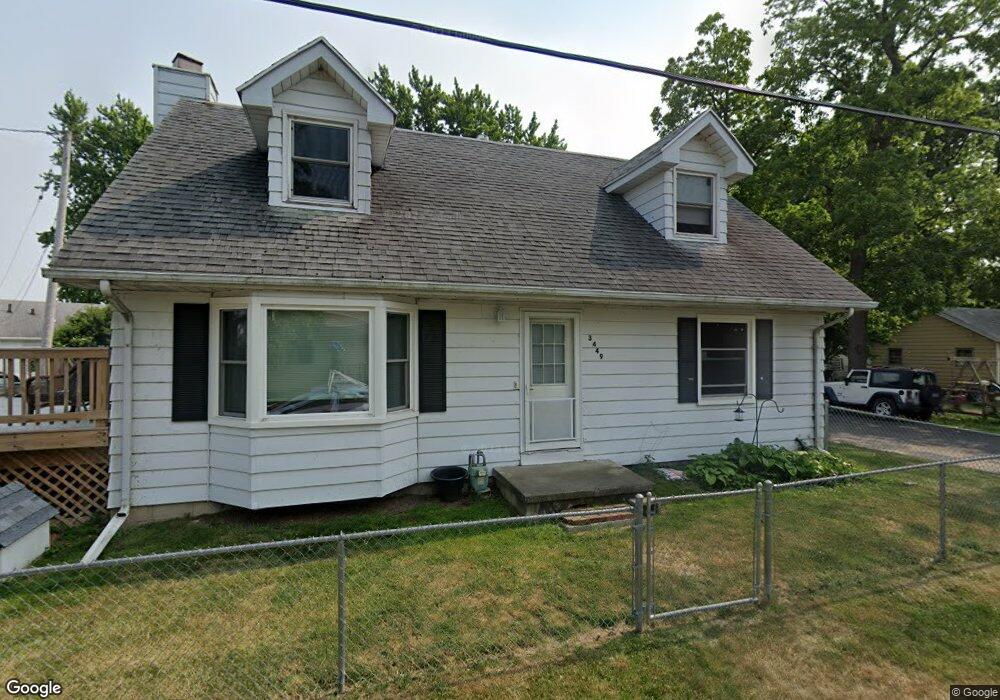
3449 140th St Toledo, OH 43611
Point Place NeighborhoodEstimated Value: $129,000 - $159,709
3
Beds
2
Baths
1,699
Sq Ft
$85/Sq Ft
Est. Value
About This Home
This home is located at 3449 140th St, Toledo, OH 43611 and is currently estimated at $144,677, approximately $85 per square foot. 3449 140th St is a home located in Lucas County with nearby schools including Edgewater Elementary School and Woodward High School.
Ownership History
Date
Name
Owned For
Owner Type
Purchase Details
Closed on
Jul 20, 2007
Sold by
Wells Fargo Bank Na
Bought by
Avenelle Eleanor N
Current Estimated Value
Home Financials for this Owner
Home Financials are based on the most recent Mortgage that was taken out on this home.
Original Mortgage
$42,642
Outstanding Balance
$27,012
Interest Rate
6.76%
Mortgage Type
Purchase Money Mortgage
Estimated Equity
$117,665
Purchase Details
Closed on
Nov 9, 2006
Sold by
Hashley Steven E and Hashley Rachel
Bought by
Wells Fargo Bank Na
Purchase Details
Closed on
Nov 1, 2004
Sold by
Hashley Shelly A
Bought by
Hashley Steven E
Purchase Details
Closed on
Oct 21, 2004
Sold by
Estate Of Madge L Hashley
Bought by
Myers Sherry A and Hashley Steven E
Purchase Details
Closed on
Oct 20, 2004
Sold by
Myers Sherry A
Bought by
Hashley Steven E and Hashley Rachel
Create a Home Valuation Report for This Property
The Home Valuation Report is an in-depth analysis detailing your home's value as well as a comparison with similar homes in the area
Home Values in the Area
Average Home Value in this Area
Purchase History
| Date | Buyer | Sale Price | Title Company |
|---|---|---|---|
| Avenelle Eleanor N | $47,400 | Chicago Title Insurance Co | |
| Wells Fargo Bank Na | $70,000 | American 1St | |
| Hashley Steven E | -- | -- | |
| Myers Sherry A | -- | -- | |
| Hashley Steven E | -- | -- |
Source: Public Records
Mortgage History
| Date | Status | Borrower | Loan Amount |
|---|---|---|---|
| Open | Avenelle Eleanor N | $42,642 |
Source: Public Records
Tax History Compared to Growth
Tax History
| Year | Tax Paid | Tax Assessment Tax Assessment Total Assessment is a certain percentage of the fair market value that is determined by local assessors to be the total taxable value of land and additions on the property. | Land | Improvement |
|---|---|---|---|---|
| 2024 | $1,318 | $37,380 | $5,810 | $31,570 |
| 2023 | $1,764 | $21,420 | $4,480 | $16,940 |
| 2022 | $1,724 | $21,420 | $4,480 | $16,940 |
| 2021 | $1,791 | $21,420 | $4,480 | $16,940 |
| 2020 | $1,793 | $17,885 | $3,745 | $14,140 |
| 2019 | $1,701 | $17,885 | $3,745 | $14,140 |
| 2018 | $2,259 | $17,885 | $3,745 | $14,140 |
| 2017 | $2,354 | $27,055 | $5,530 | $21,525 |
| 2016 | $2,404 | $77,300 | $15,800 | $61,500 |
| 2015 | $2,798 | $77,300 | $15,800 | $61,500 |
| 2014 | $1,702 | $27,060 | $5,530 | $21,530 |
| 2013 | $1,702 | $27,060 | $5,530 | $21,530 |
Source: Public Records
Map
Nearby Homes
- 5912 Edgewater Dr
- 3479 145th St
- 3469 146th St
- 10 Edgewater Park
- 5618 Edgewater Dr
- 3041 135th St
- 3146 131st St
- 3733 149th St
- 3045 129th St
- 3107 125th St
- 6143 Randon Dr
- 5338 305th St
- 5542 N Summit St
- 5415 302nd St
- 5220 302nd St
- 2930 123rd St
- 5531 Ottawa River Rd
- 3010 118th St
- 2930 118th St
- 2819 119th St
- 5910 318th St
- 3453 140th St
- 5855 318th St
- 5829 318th St
- 5852 Lakeside Ave
- 5852 Lakeside Ave
- 5858 Lakeside Ave
- 3463 140th St
- 3463 140th St
- 5848 Lakeside Ave
- 5848 Lakeside Ave
- 5844 Lakeside Ave
- 5909 318th St
- 5842 Lakeside Ave
- 5836 Lakeside Ave
- 5864 Lakeside Ave
- 5864 Lakeside Ave
- 5901 Lakeside Ave
- 3431 140th St
- 5838 Lakeside Ave